
General navigation and core functions
This page covers the familiarization of the CORTEX Service Web Application and tips&tricks for increasing the use of CORTEX Service on your Airport.
Modifying the CORTEX Service system settings and parameters is handled in CORTEX Service - Configuration sections.
Navigating through the web application is done through the 5 main tabs that are accessible on the top bar.

STATUS (Legacy) or COCKPIT (For Airside Cloud connected customers)
WORKSPACES (⭐ this is new feature in CORTEX Service 2024 Fall version, replacing the ‘MAP’ tab)
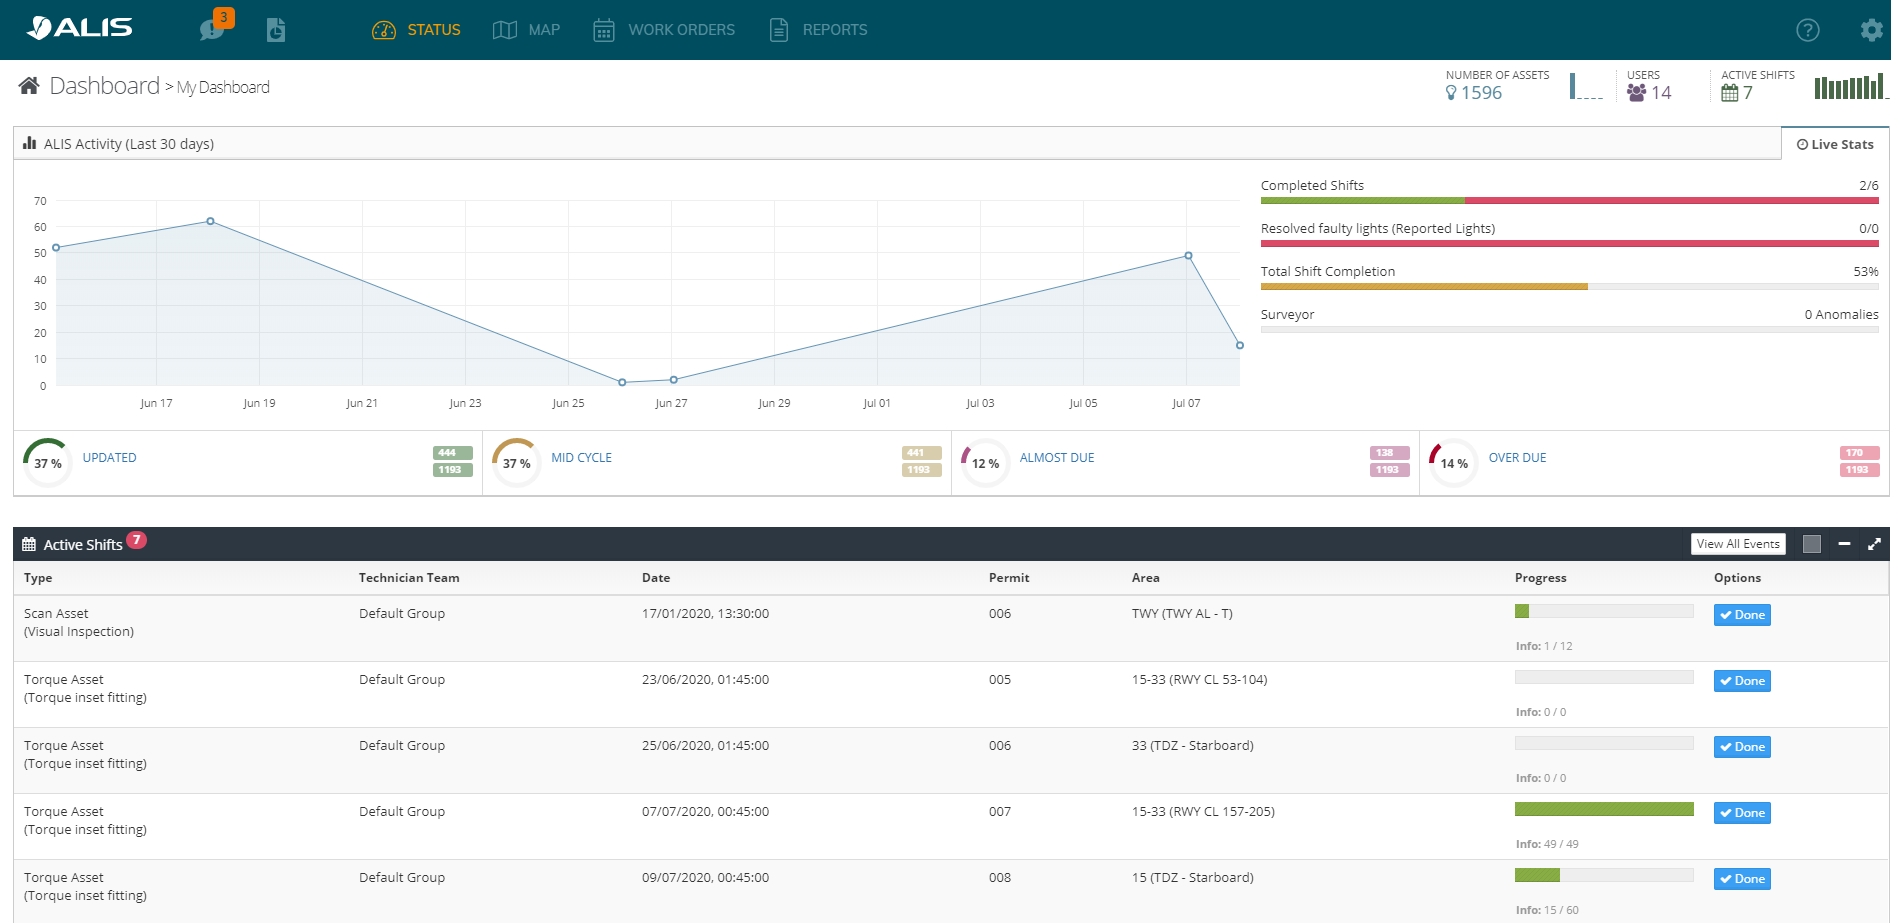
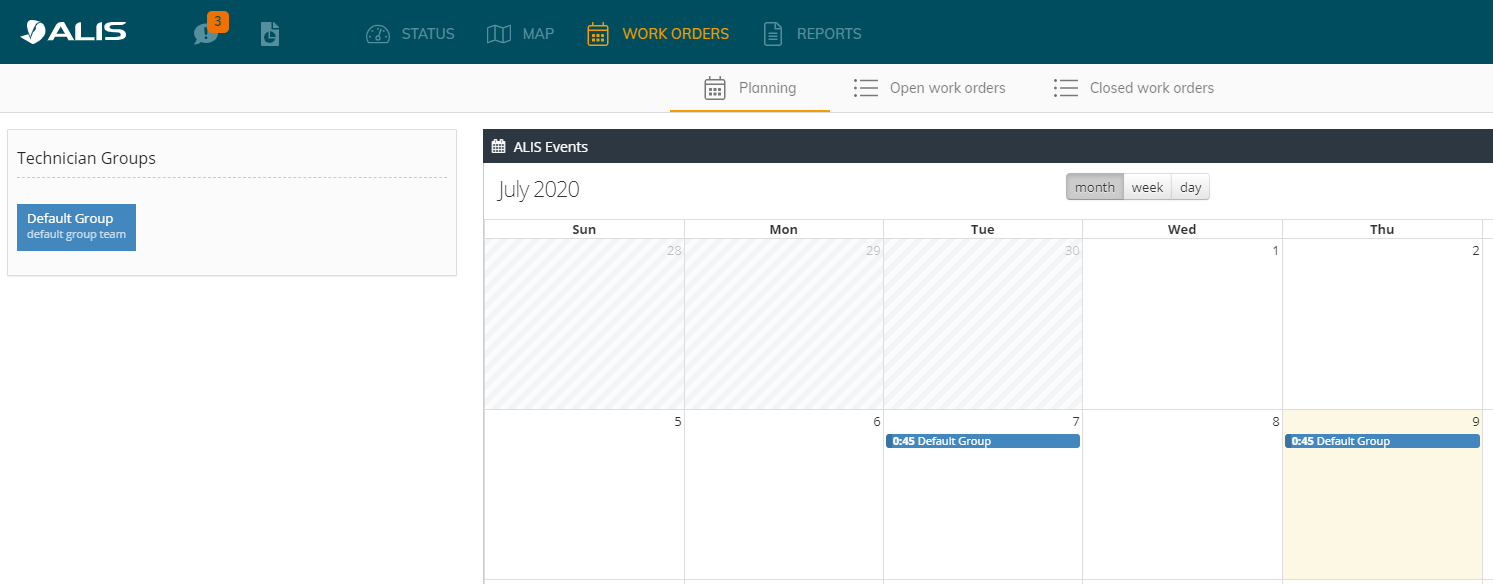
STATUS
The Status Page will get you a quick overview on:
The amount of assets that have been maintained by work-order per day for the last month ( Top left Graph)
A bar -visualization of the activity in the last month ( - 30 days) ( top Right bars)
Completed shifts in relation to total shifts created
Faulty assets resolved to total amount of assets marked faulty
Percentage of assets maintained in relation to how many that needs to be done
The amount of Observations that where created
A Distribution on the maintenance status of all assets in the system (Middle - below Graph)
Assets that are recently maintained ( 0- 33% of cycle) in relation to total amount of assets ( Green)
Assets that are in the middle of their maintenance cycle ( 33%-66%) in relation to total amount of assets ( Light Green)
Assets that are almost Due in maintenance ( 66% -100%) in relation to total amount of assets ( Orange)
Assets that are Due in maintenance (>100%) in relation to total amount of assets ( Red)
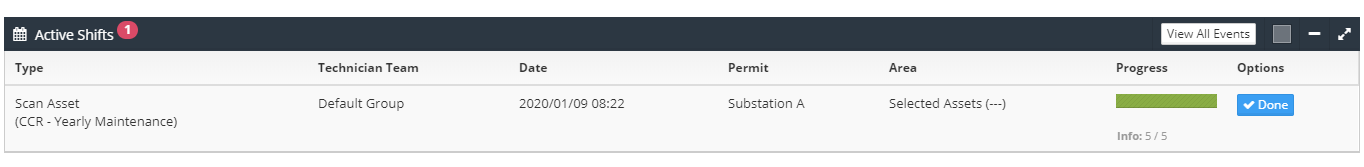
The Open work-orders and their real-time progress ( Bottom part - Active shifts)
You can close the work-orders from here once they are completed so that they will be removed from the on-site devices.
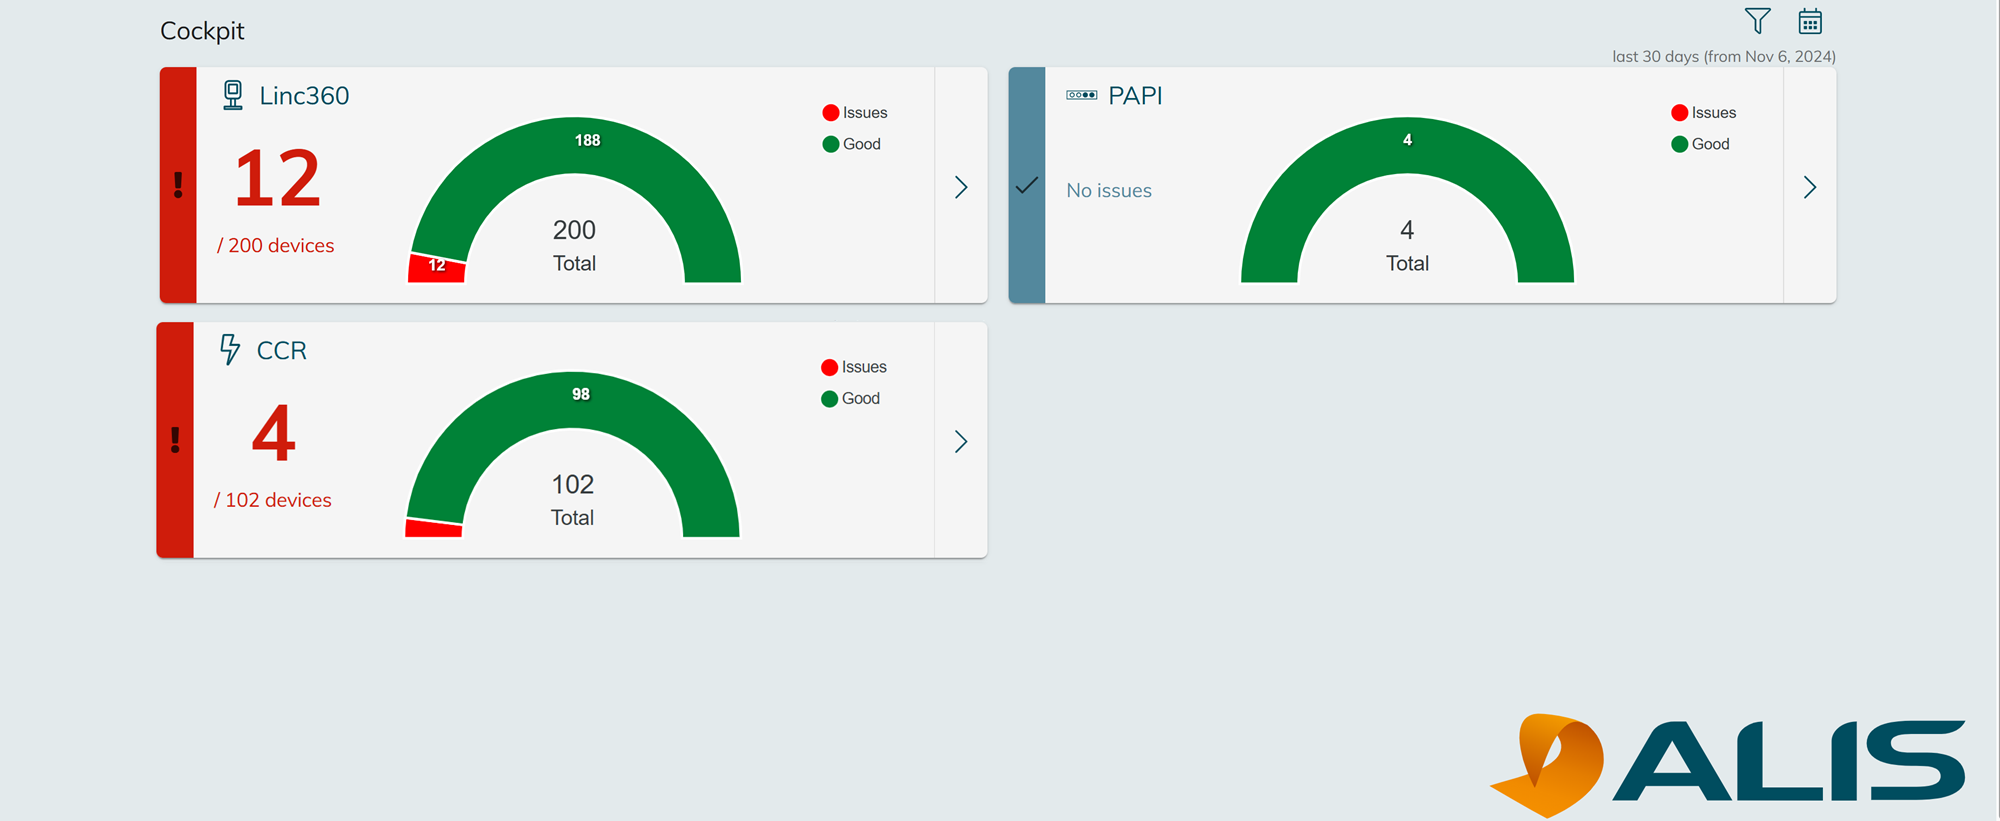
COCKPIT
The overview of the airside cloud data can be visualized in the cockpit. From here, you can navigate to each type of connected devices. Read more about it here - https://support.adbsg-alis.com/ALIS/alis-cortex-cloud
Don’t see the COCKPIT on your navigation bar? For now , The cockpit is only for customers with Airside Cloud devices.
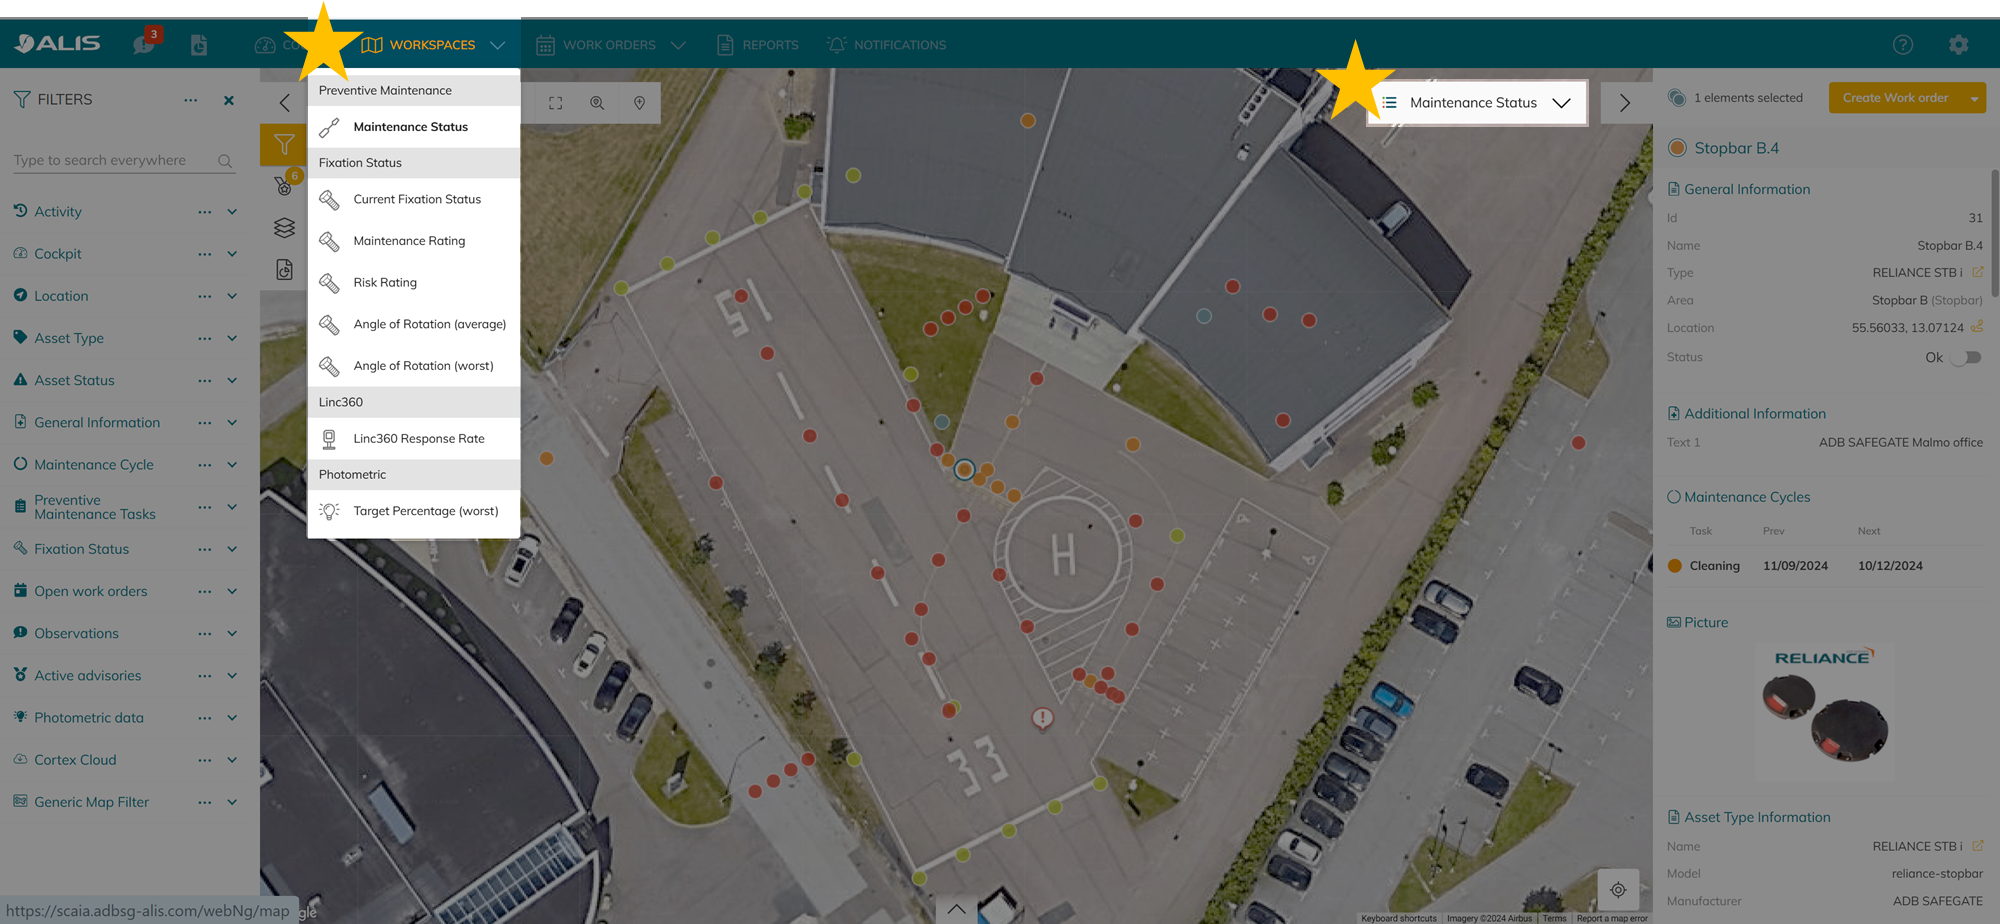
WORKSPACES
The “MAP” has been replaced by “Workspaces” from CORTEX Service 2024 Fall version. The new workspaces come with an additional feature that allows users to visualise the assets in different colours according to the workspace that they’re working on.
The workplace (formerly ‘map’) is for the maintenance managers to:
Visualise assets
Schedule work orders from selected assets
Monitor work order progress
View all airports assets status
Track faulty assets
Track observations made on-site
Asset Reporting & auditing purposes
Register maintenance directly from the web.
 Read more
View all assets status
The map workspace display the assets that are registered in the system. The status of the assets is shown as colours.
The colours are depends on which workspace you choose. You can see the meaning of the colours from the legends at the top right.
The color of the assets represent the maintenance status of that asset in accordance with it's maintenance cylces.
By default we show the maintenance status color that is the most critical ( in consideration with the activated filters).
These are the different % on which color is going to change.
Preventive maintenance state | Maintenance cycle has reached | Color of maintenance status |
|---|---|---|
Recently Updated | 0-33% | Green |
Good condition | 33%-66% | Light Green |
Awaiting maintenance | 66% - 100% | Orange |
Maintenance overdue | 100% and above | Red |
For example : If a maintenance cycle is set to do every 100 days and the last time the maintenance was performed was on the first of January (1/1 ) then:
The color of the asset will be green up to approximately the 3th of feb.
The color will be light green up to approx the 8 th of march ( 66% of 100 days= 66 days later ).
Then the color will be yellow up to the 10th of April - 100 days after last maintenance.
After the 10th of April the color will become red because it has been 100 days since the maintenance task was performed.
These workspaces are interesting on users who use CORTEX Service to record torque maintenance data.
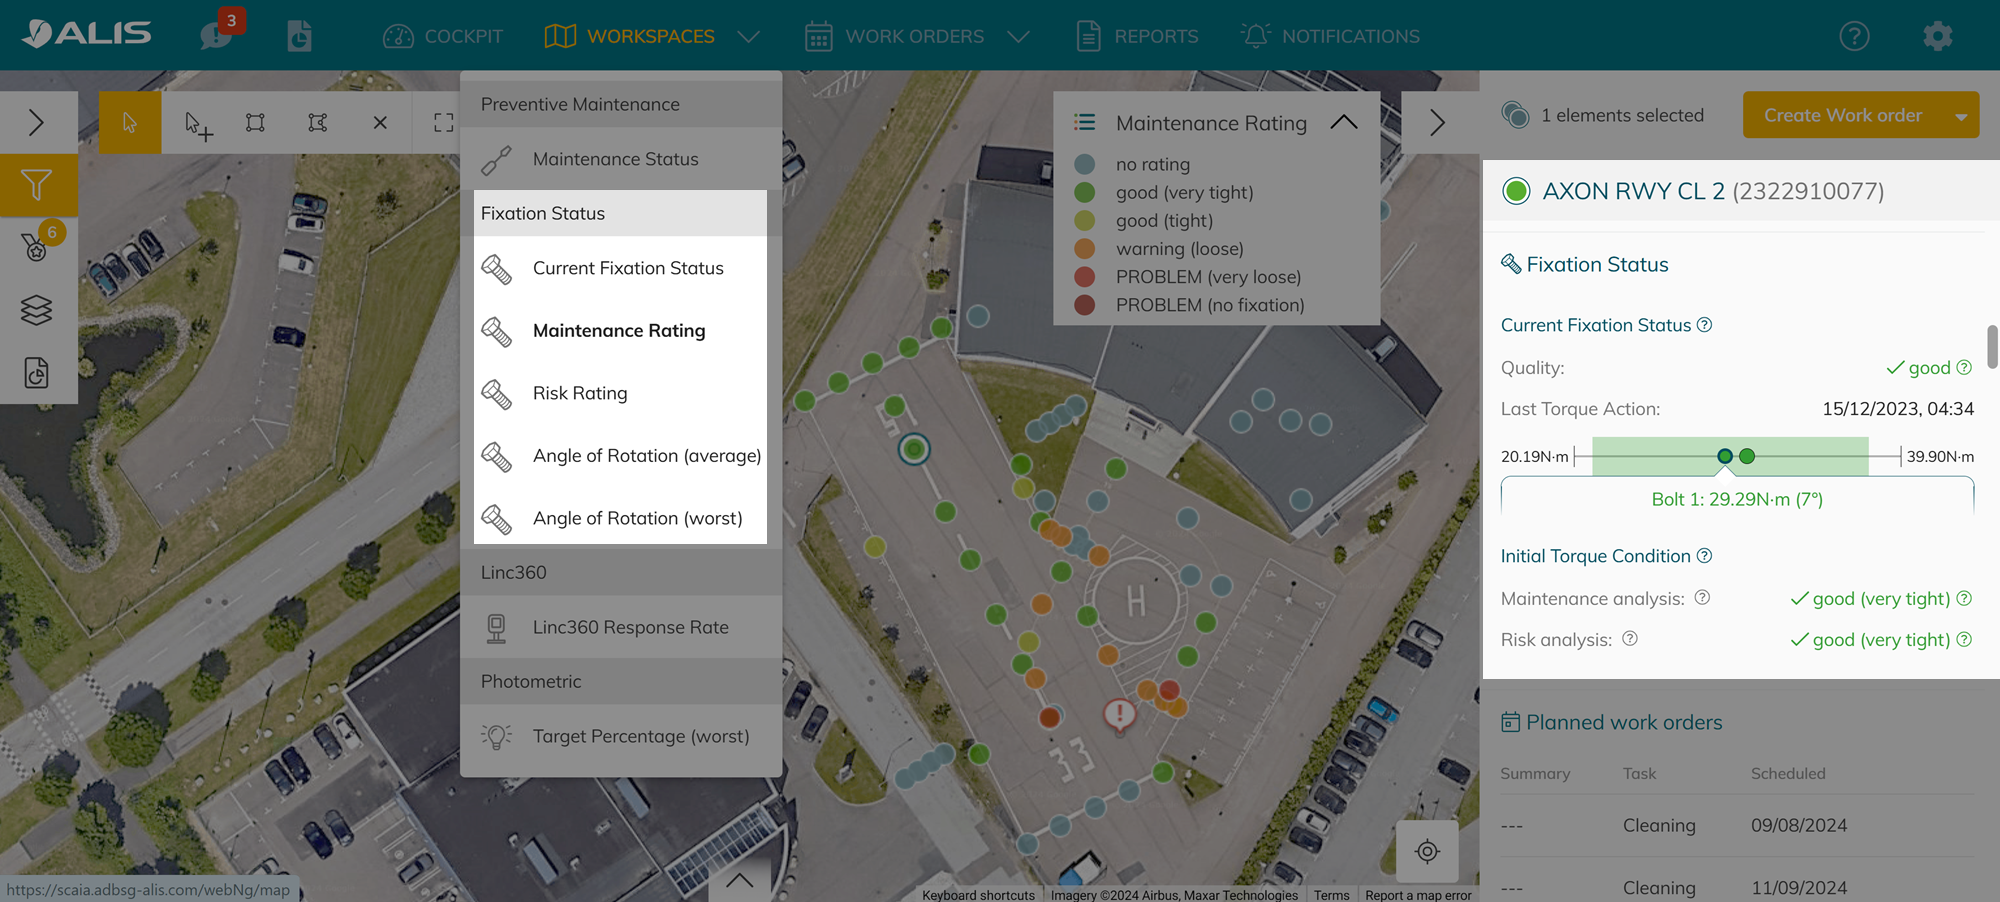
Workspace | Legends | Wrench for recording this data |
|---|---|---|
Current Fixation Status | 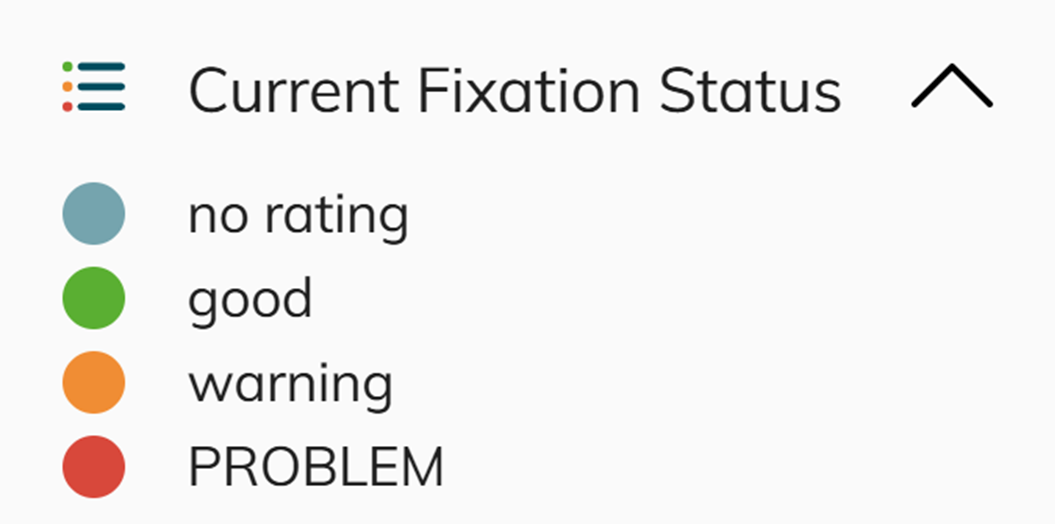 More information: current fixation status |
|
Maintenance Rating | 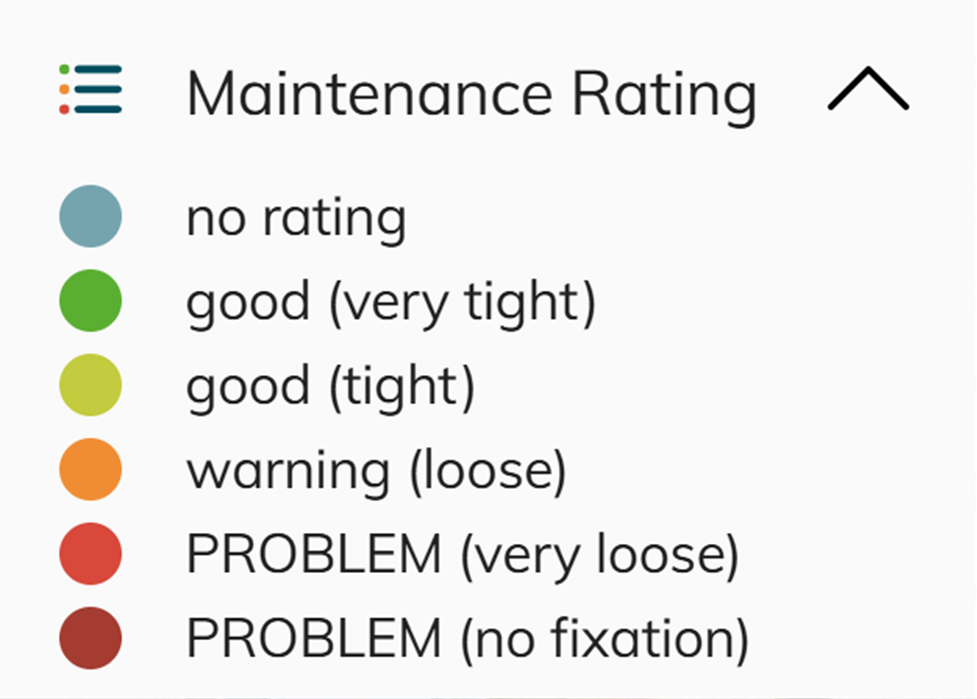 More information: maintenance rating |
|
Risk Rating | 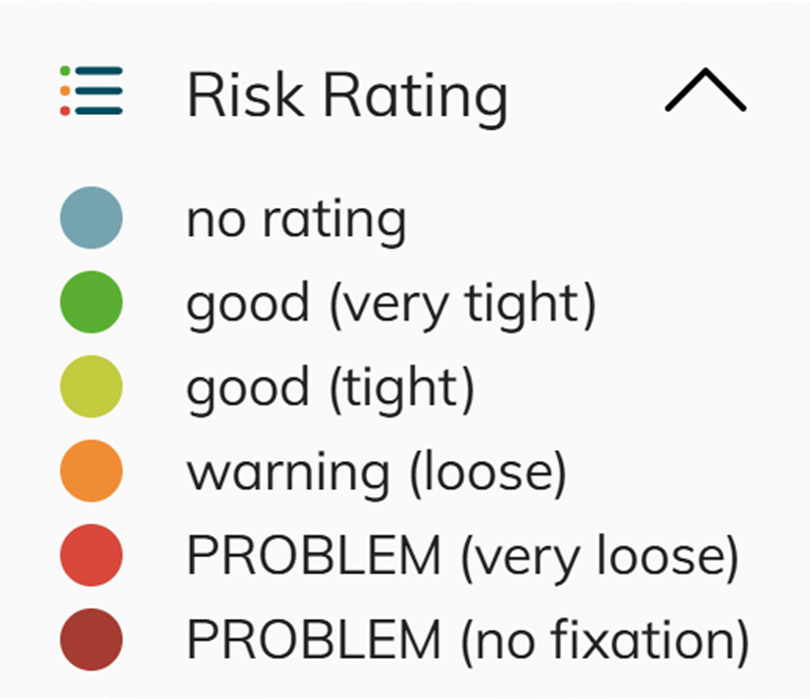 More information: risk rating |
|
Angle of rotation (average) | 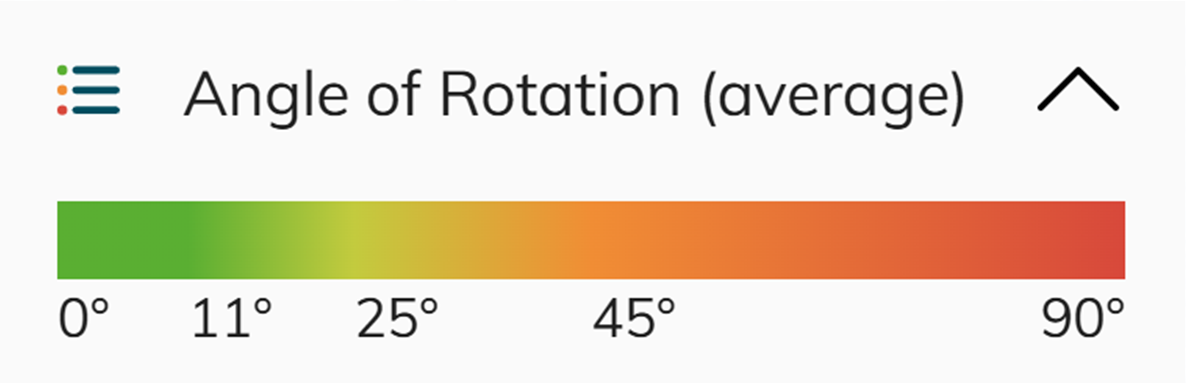 |
|
Angle of rotation (worst) | 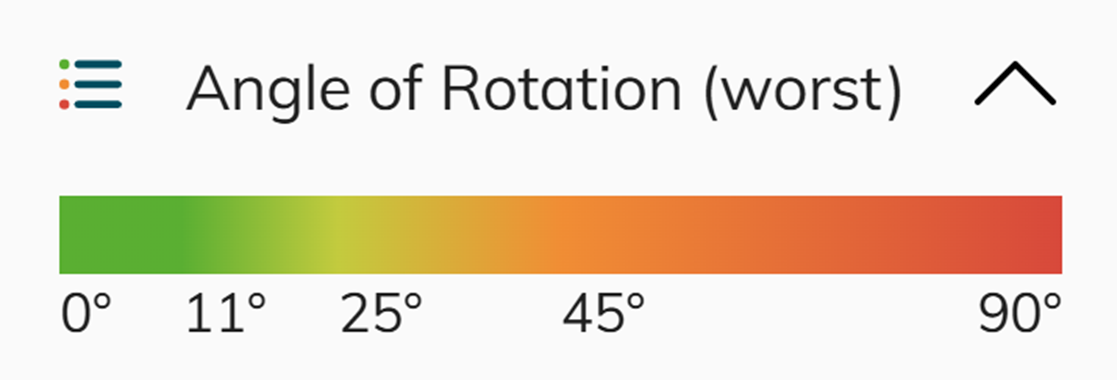 |
|
Read the full article on fixation status: https://support.adbsg-alis.com/ALIS/fixation-status#Fixationstatus-Riskanalysis
Find out more about CORTEX Service compatible wrench: https://alis.adbsg.com/on-site/
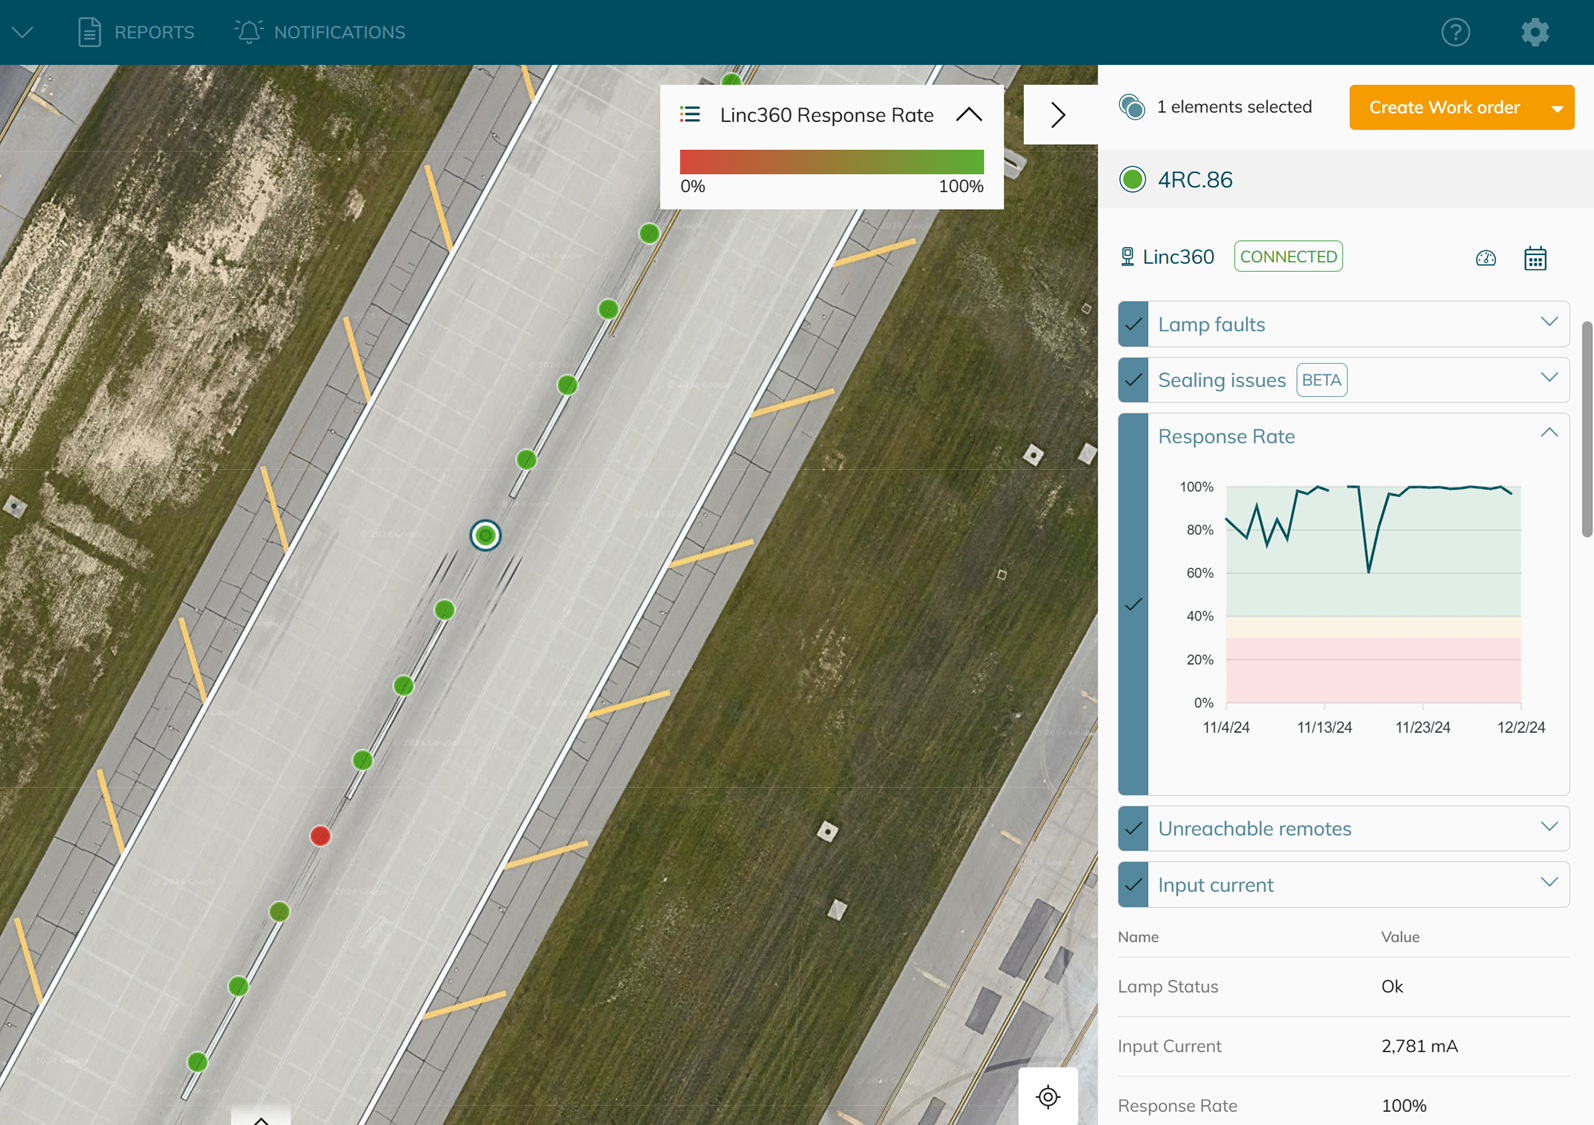
This workspace is used to visialise the response rate of Linc360. This workspace is only applicable for Airside Cloud connected users!
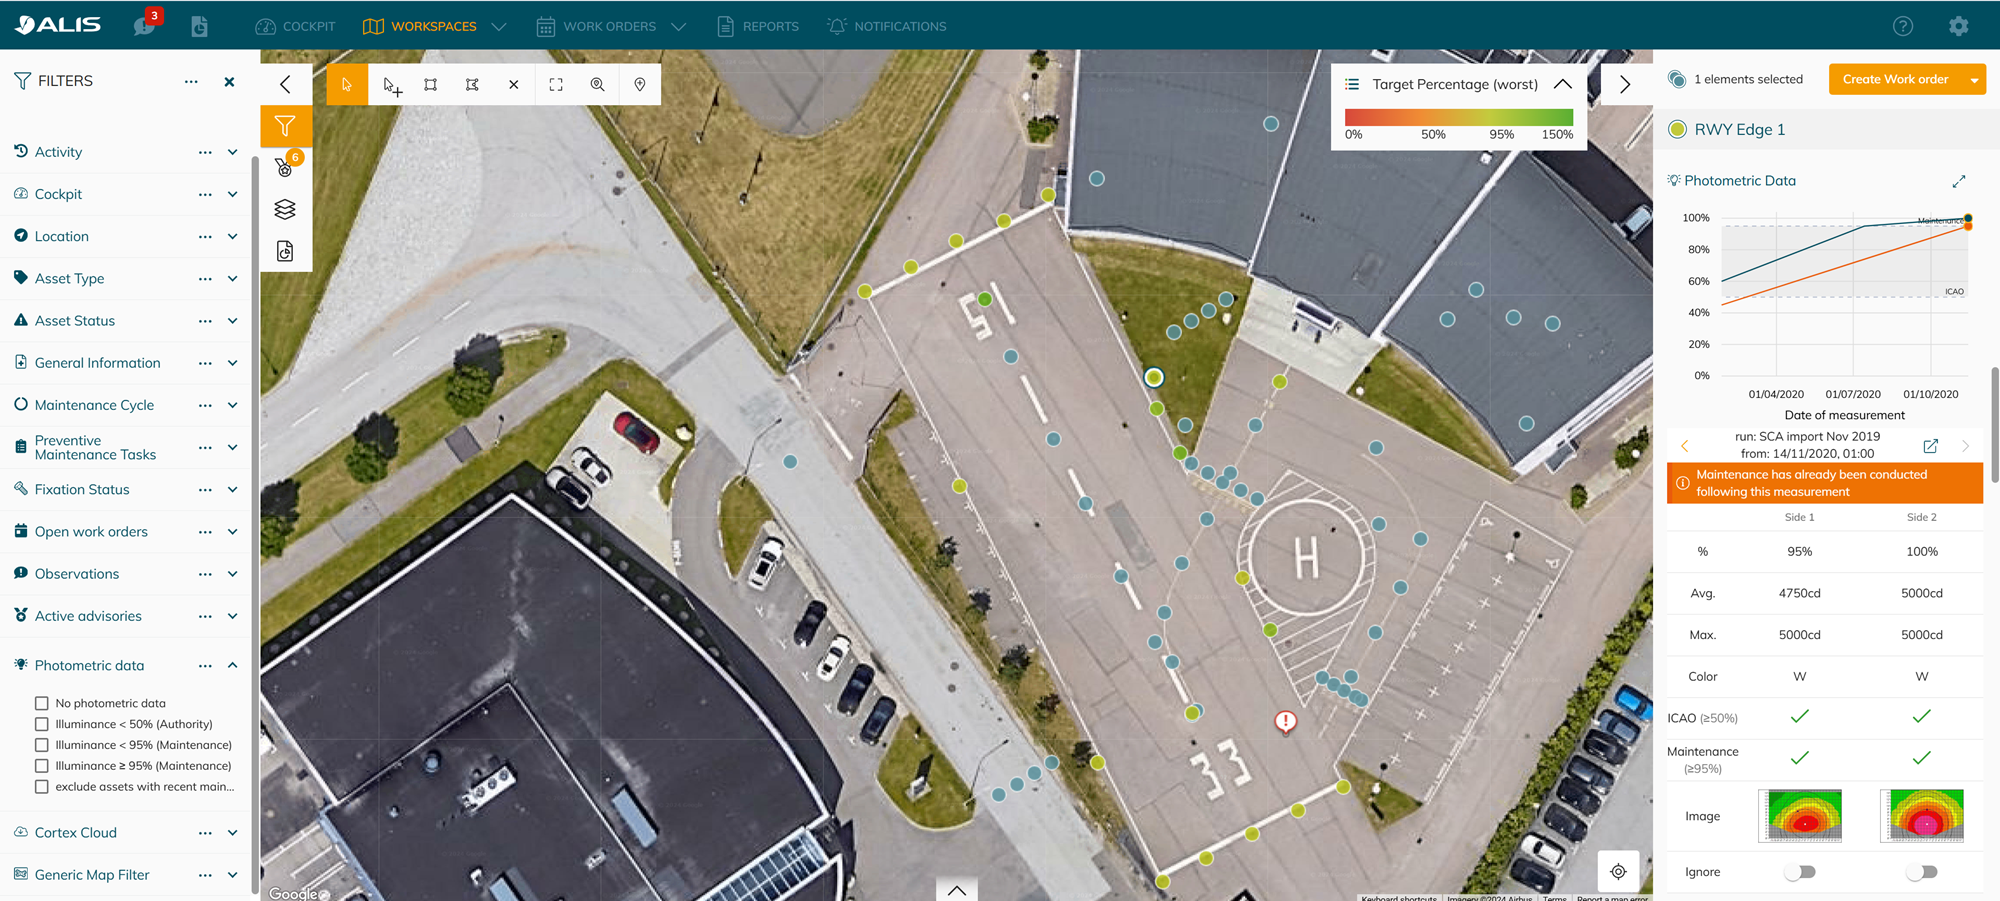
This workspace is worst target percentage of phometric value.
What do we mean with “Worst” ? A light fitting can have 2 sides and so each asset could have 2 illumination % values. We will show the “lowest” or “worst” value of the two as that is the value that is important for you to perform maintenance on this asset.
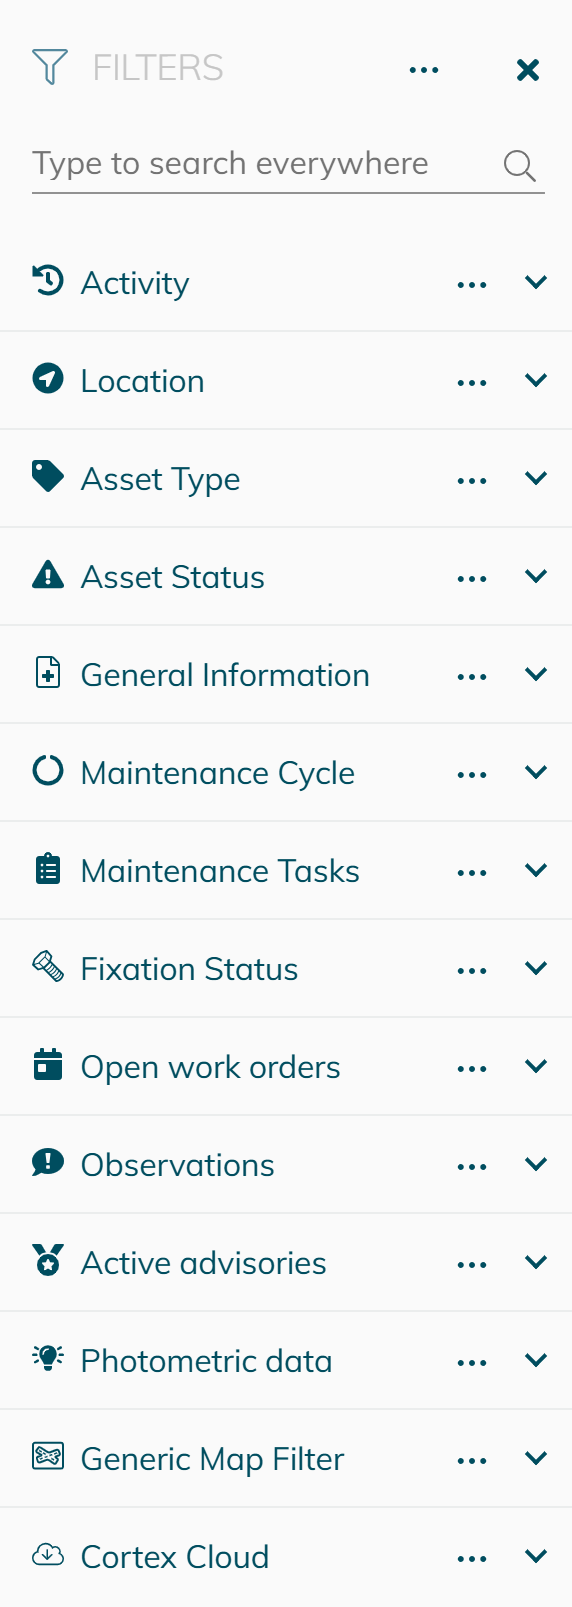
Map Filters
On the left panel of the workspace, you can efficiently filter for assets that you’re looking for.
Map Settings
This setting let the user configure the map:
Toggle the Asset table to the Observation table for a better overview of your observations and export features!
Enable or Disable certain markers in order to focus on the work at hand.
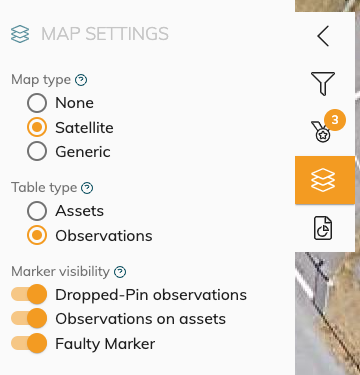
Tip: from the map setting, you can also choose to complete hide assets or just make them slightly transparent (ghosted) like this picture below.
Schedule work orders
Custom work order
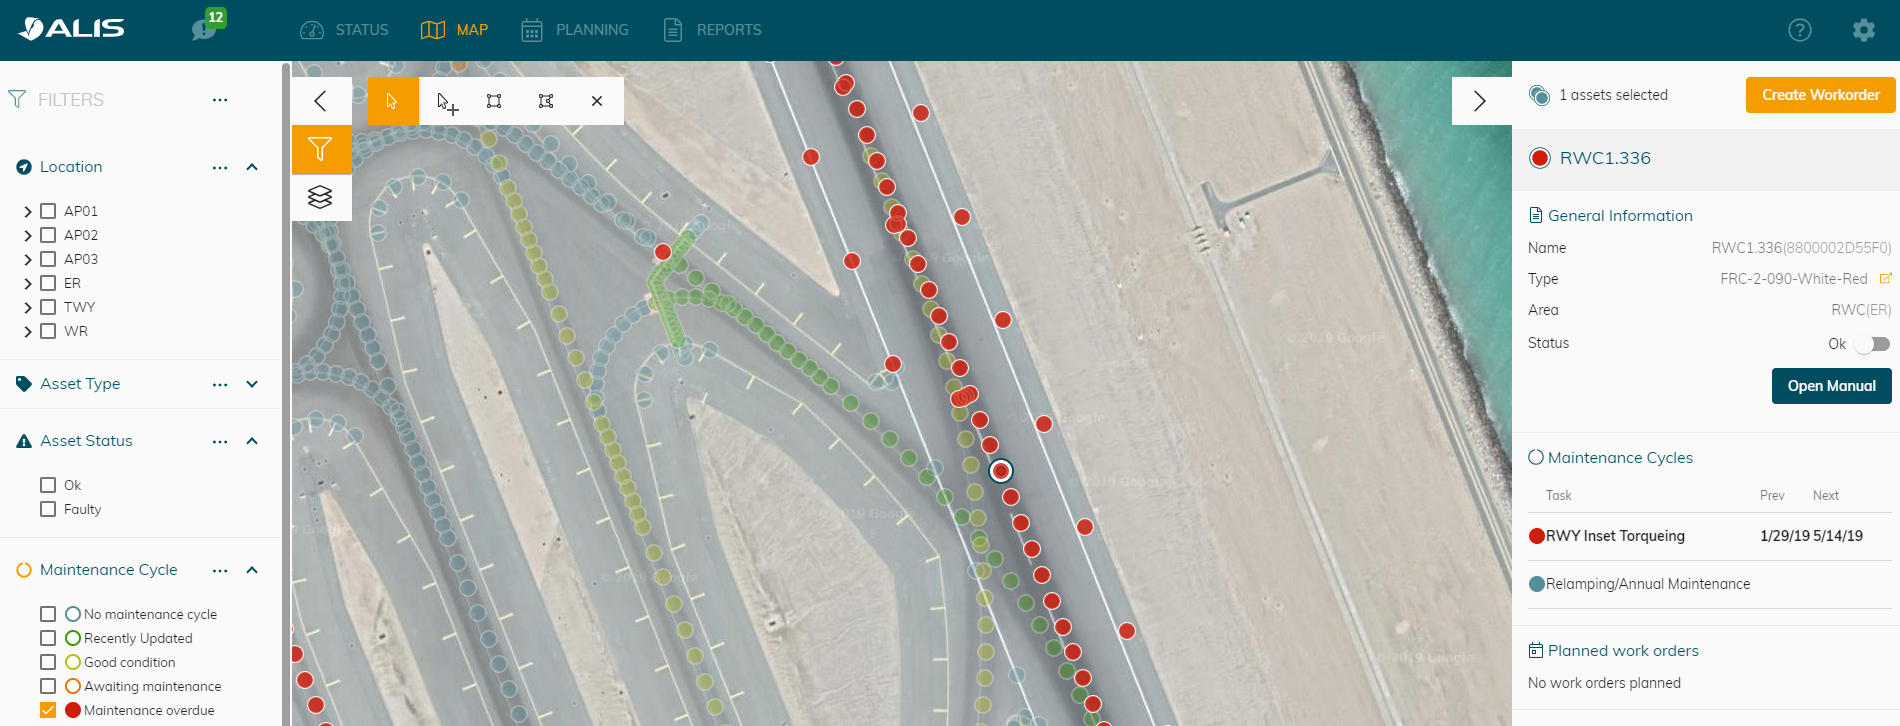
By use of the selection buttons on top we can select only the assets we want to create a work order for.
 | Revert back to the normal/unique asset selection tool |
 | Add/remove a single asset from the current selection |
 | Add/Select a group of assets by drawing a rectangle over the assets |
 | Add/Select a group of assets by use of a polygon. Always finish your polygon by clicking on the first node created. |
 | clear the selection |
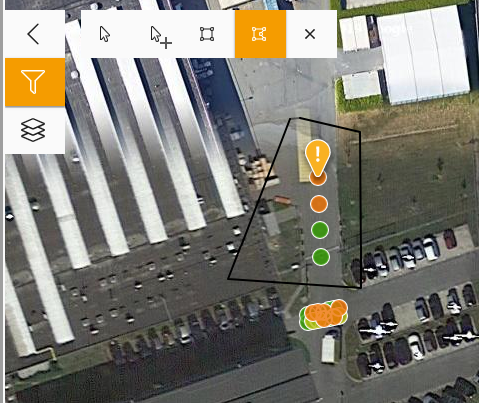
![]() Highlighted assets will have a thick white edge.
Highlighted assets will have a thick white edge.![]() A detail selected asset ( details pane on the right) will have an additional blue ribbon edge -only 1 asset can be detail selected.
A detail selected asset ( details pane on the right) will have an additional blue ribbon edge -only 1 asset can be detail selected.
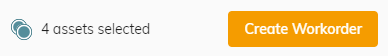
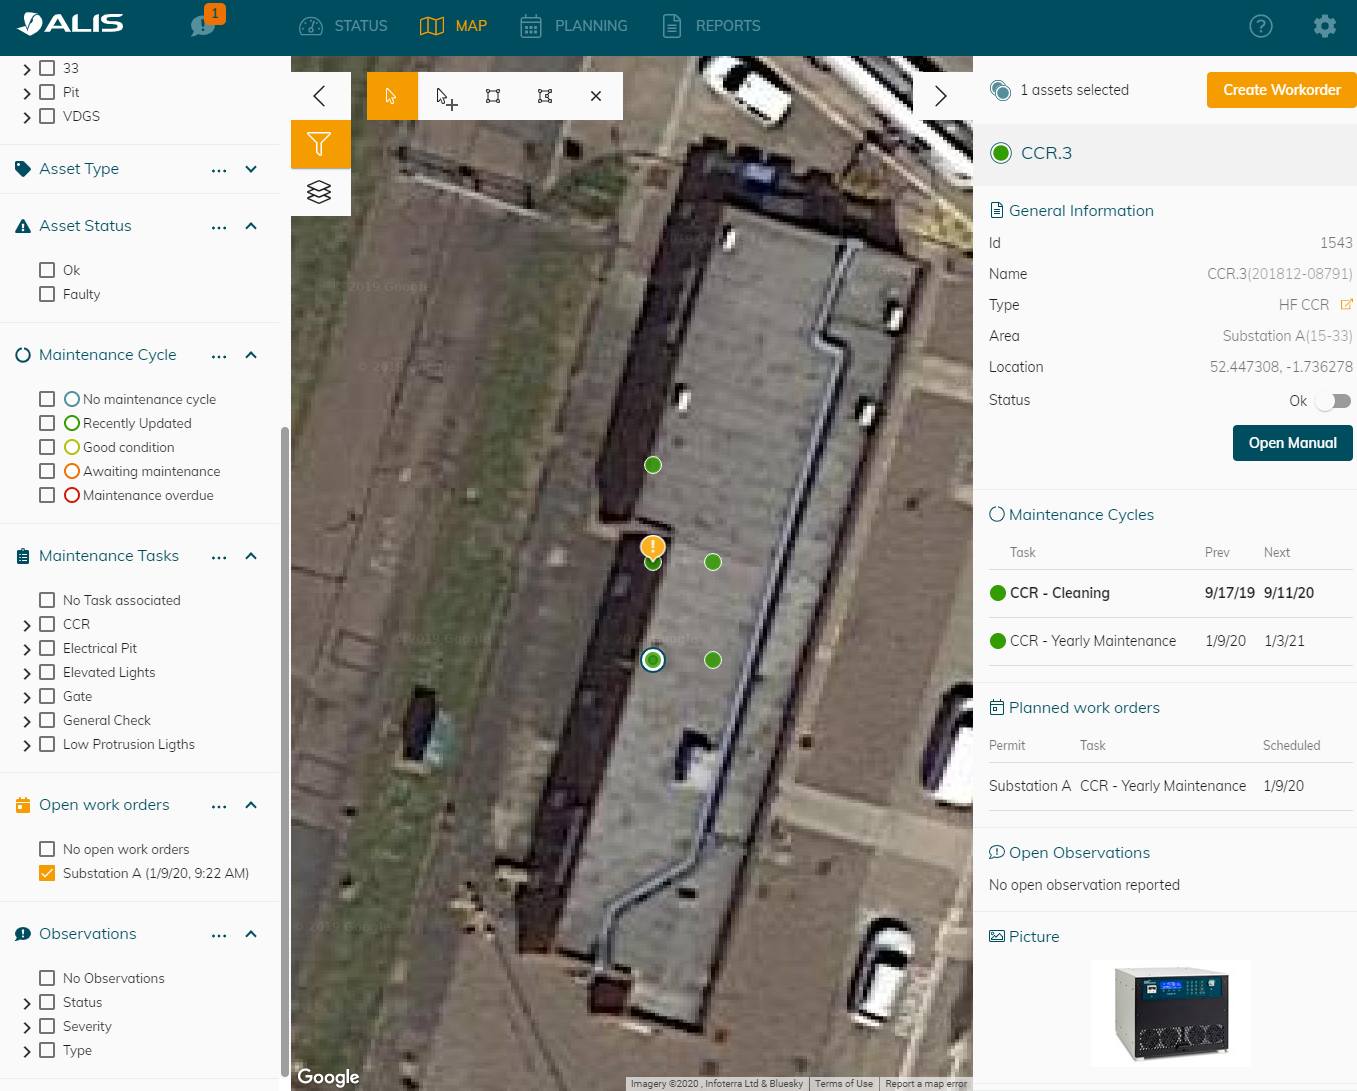
When one or multiple assets are selected the "Create workorder" button can be used to create a work order from the selected group.
The amount of assets selected is mentioned next the button.
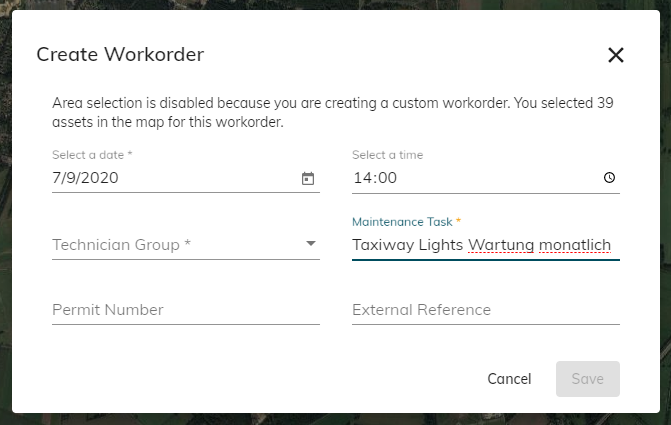
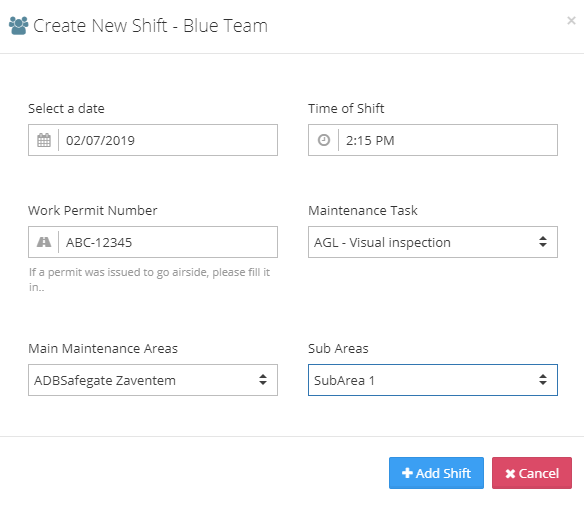
Next you will get a pop-up that will ask need you to fill in :
The maintenance task that needs to be performed
Which Team/Group will have access to the task to perfrom it
Optionally - A permit number or additional description of the task
Optionally - A reference number to an external system that can help you to link this up
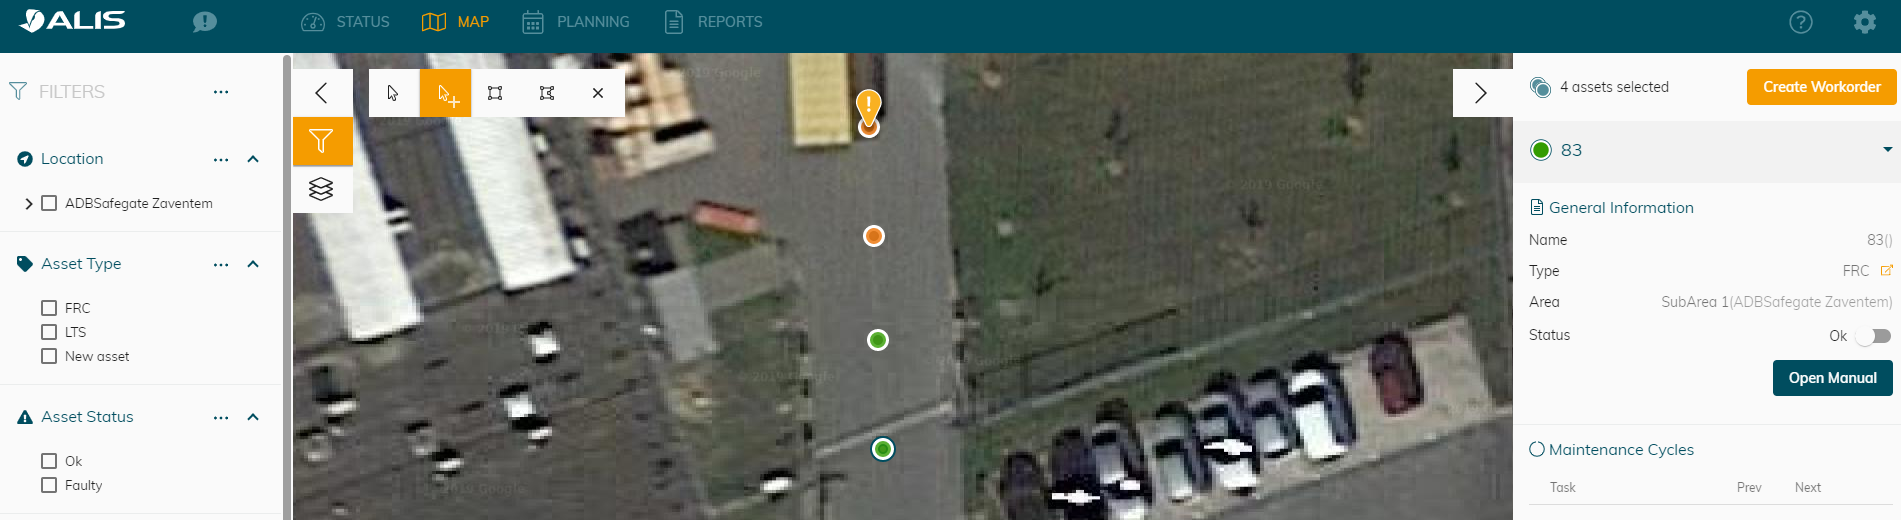
The asset selection tool and the filters can be used in combination with each other!
When a group of assets is selected and an additional filter is activated - the amount of assets selected will change depending on the filter criteria!
As a general rule - The filter selection active will overrule previous selected assets - what you see is what you get!
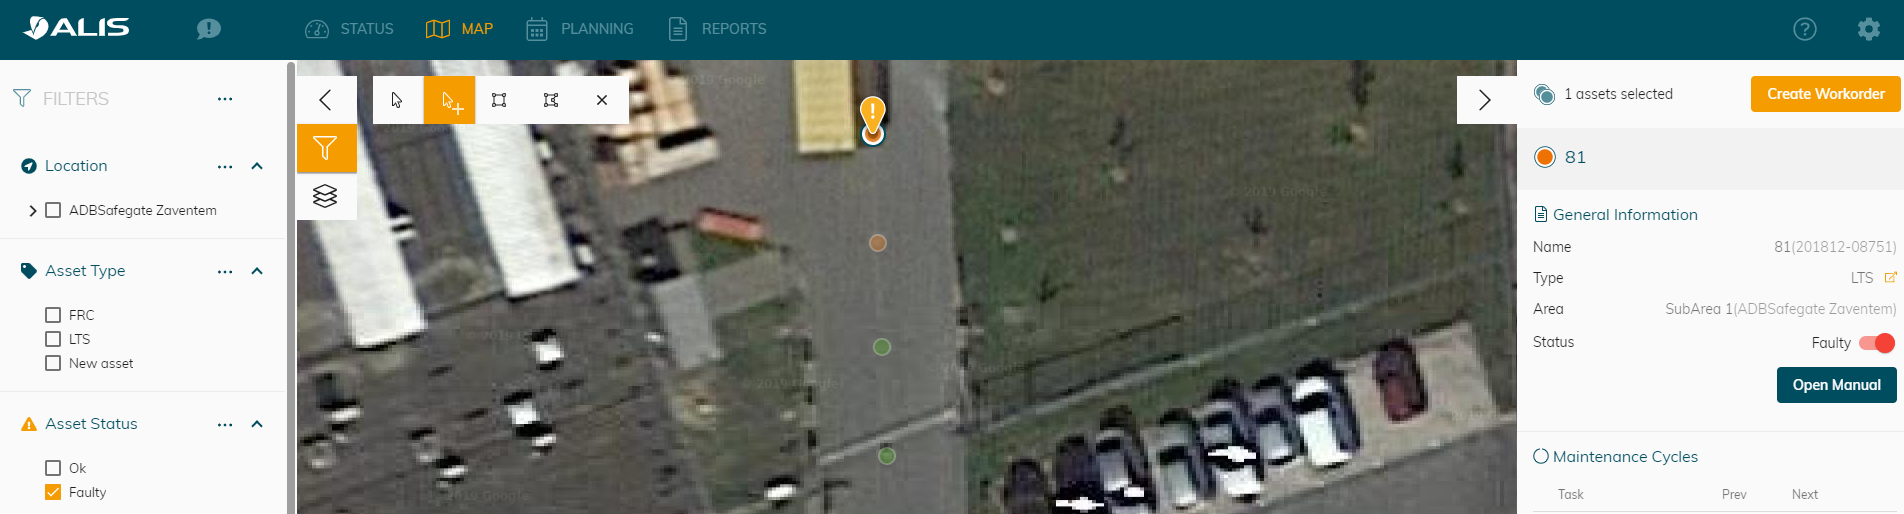
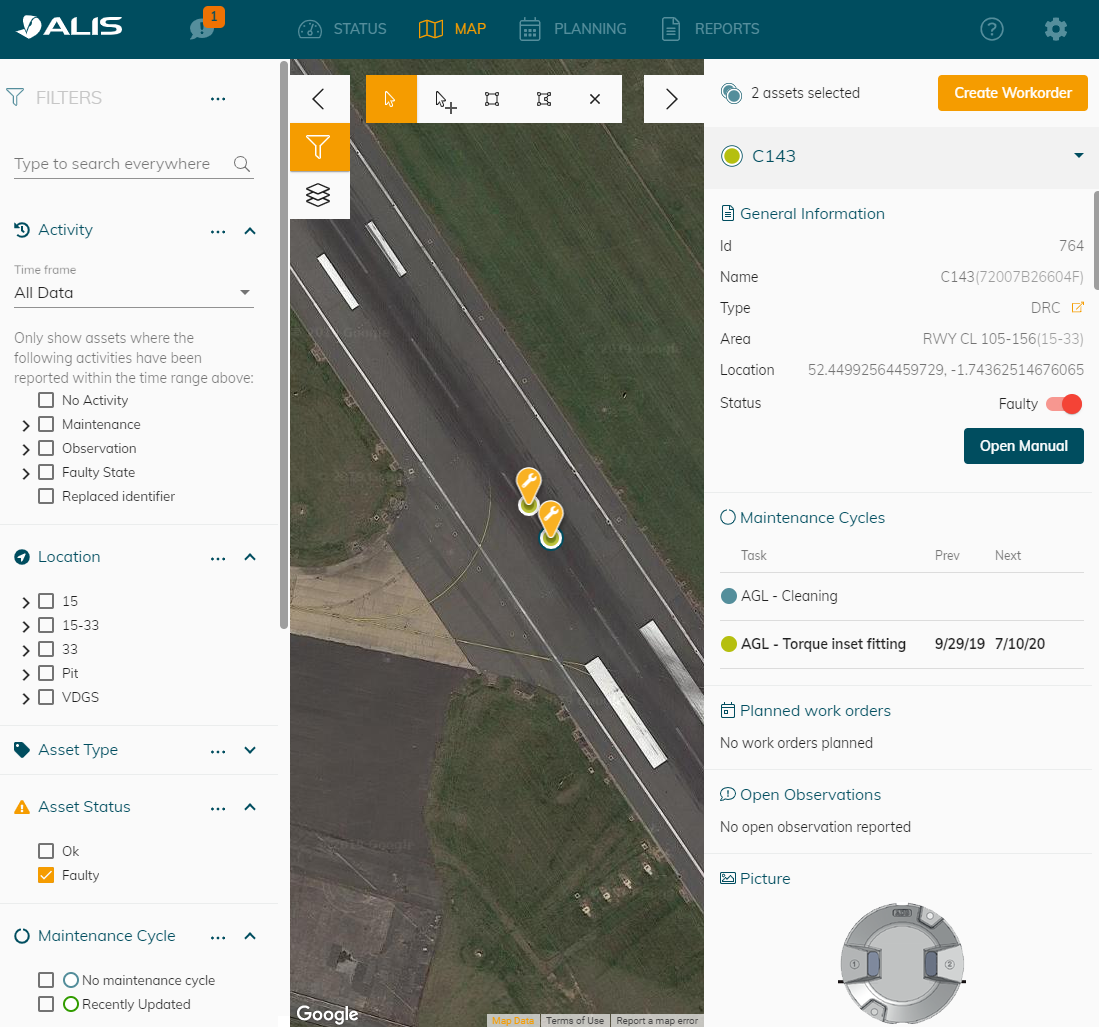
When activating the Asset status Filter "Faulty" the amount of selected assets is reduced from 4 to 1 .
WORK ORDERS
This tab allows you to see the overview of the work orders that you have created. You can see the details, progress, and take the necessary action.
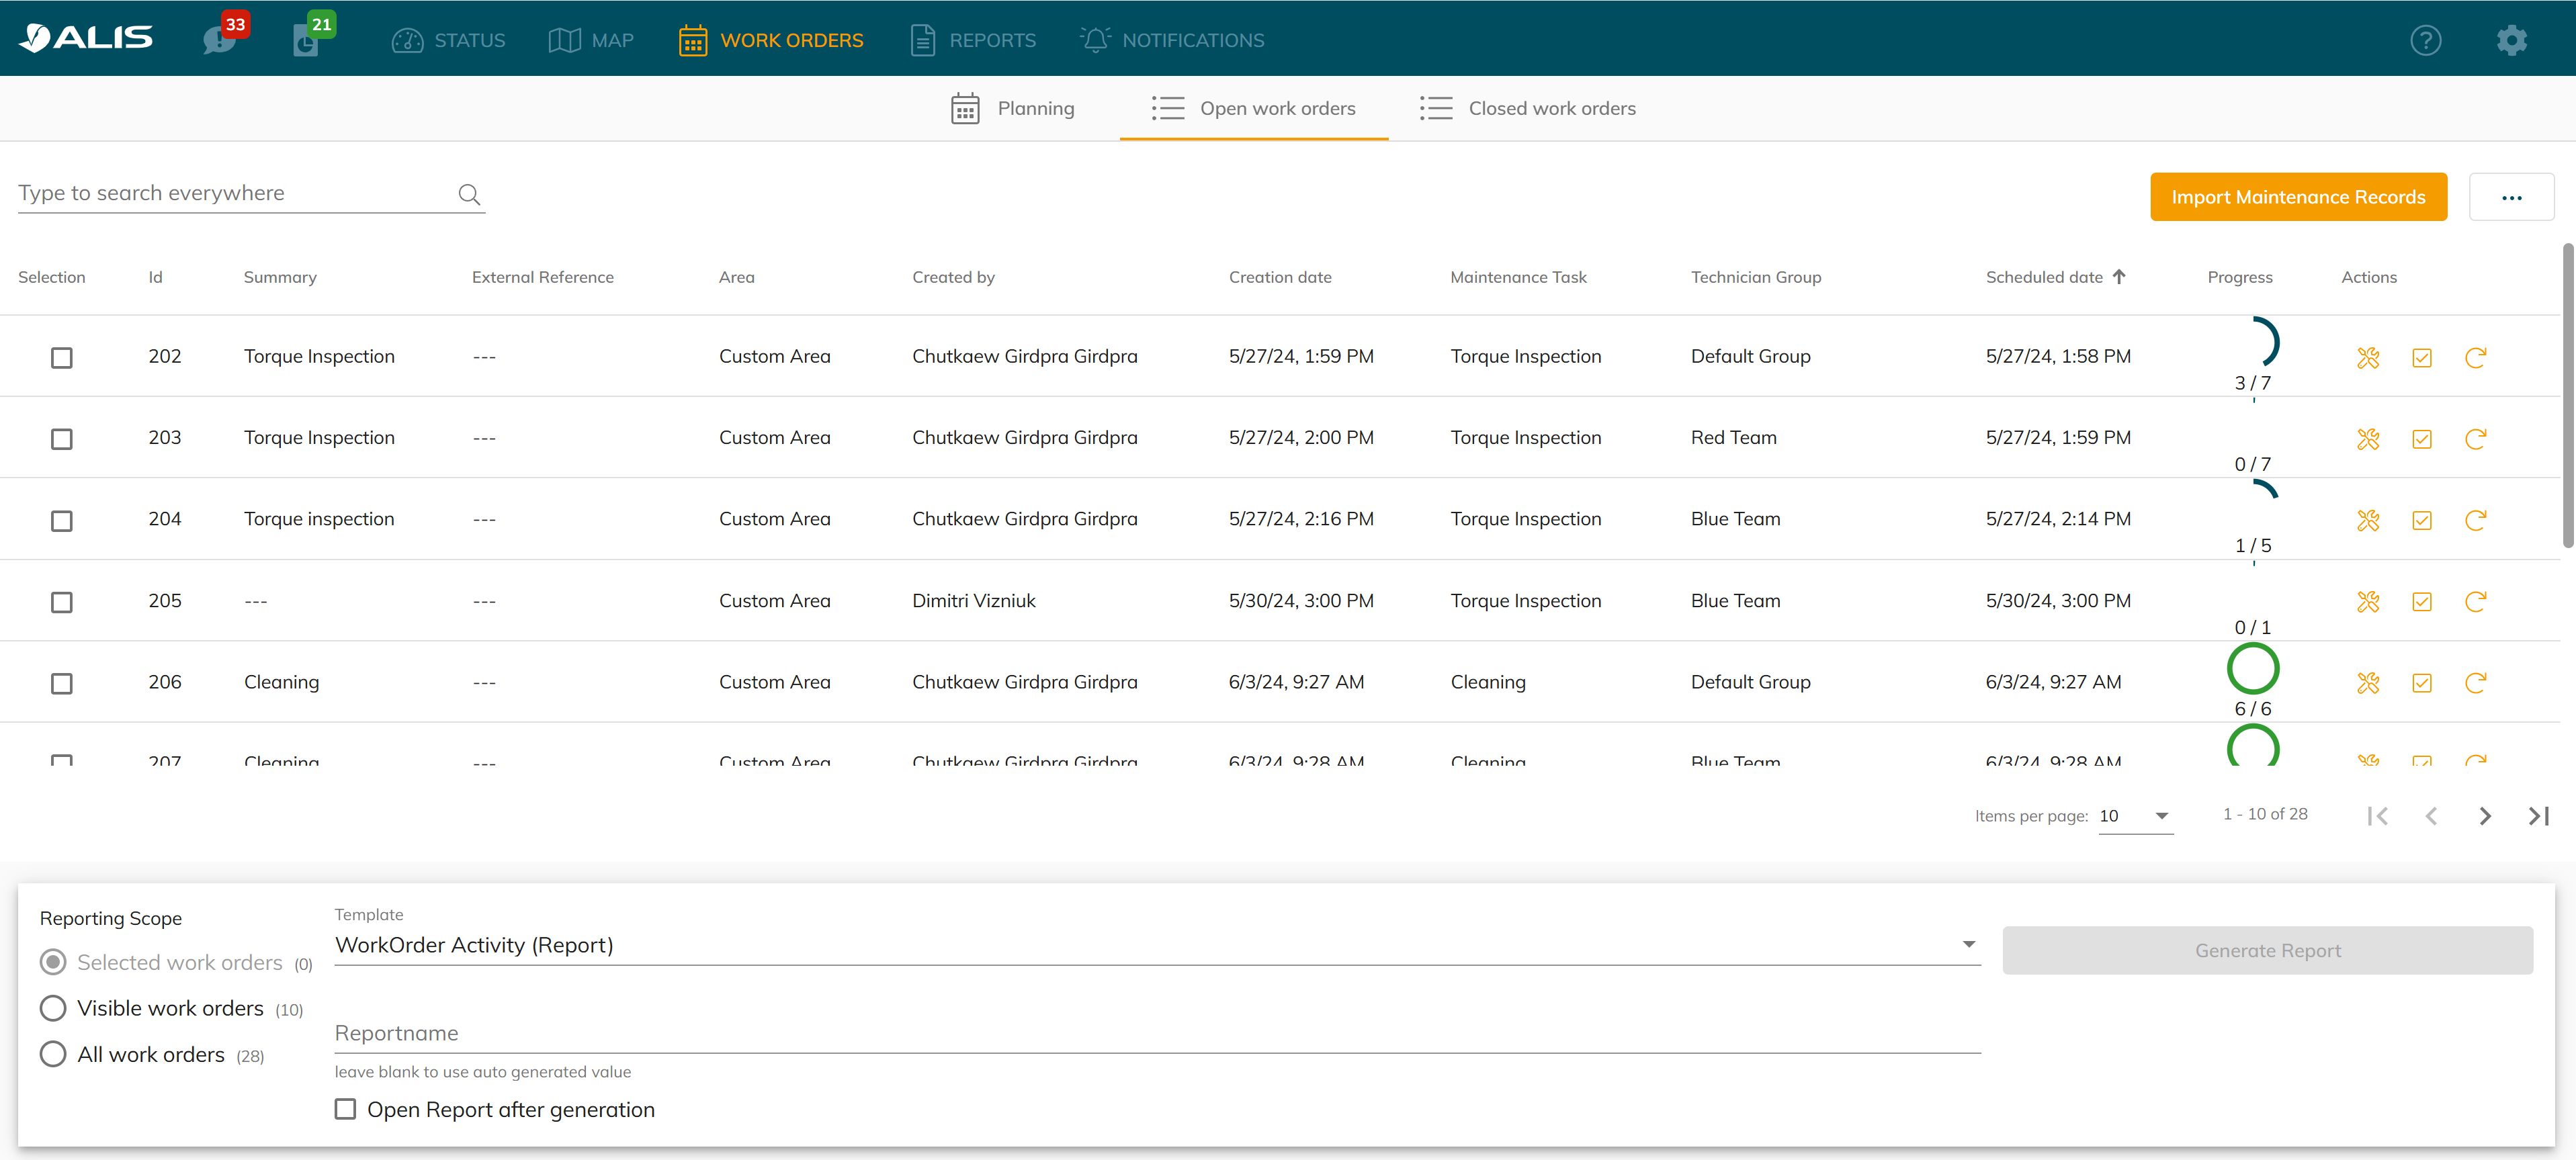
Area-based work order ( From the Work order Tab)
All assets are divided in Area's and Sub Areas.
An area is a physical division to geographical know where an asset or group of assets is located (ie: Runway 25L or 25R )
A sub Area is typically a group of lights that belong to one function and that can be maintained in 1 or multiple days. ( not weeks or months) (ie: the Runway edge of runway 25L )
We can now plan our work orders according to these pre-defined Area's or Sub Area's.
To do this we go into the planning tab and drag and drop the desired maintenance team on the date when the work order should take place
We can then enter the details of the work order:
![]() Work orders will be available on the iOS app from the moment that they are created.
Work orders will be available on the iOS app from the moment that they are created.
Monitor work order progress
Through the STATUS Page
The active shifts are visible in the STATUS page and progress bar will inform you on the advancement.
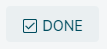
Once all assets are maintained, the DONE button can be clicked to acknowledge the completion of the work perfromed by the manager and to remove the task from the task list of the technicians.
Map view
By using the OPEN WORK ORDERS Filter in the filter menu, you can visualize the assets included in a work order and to verify the advancement of the work performed.
The closing of the work order still needs to happen in the STATUS page or in the PLANNING - LIST VIEW page.
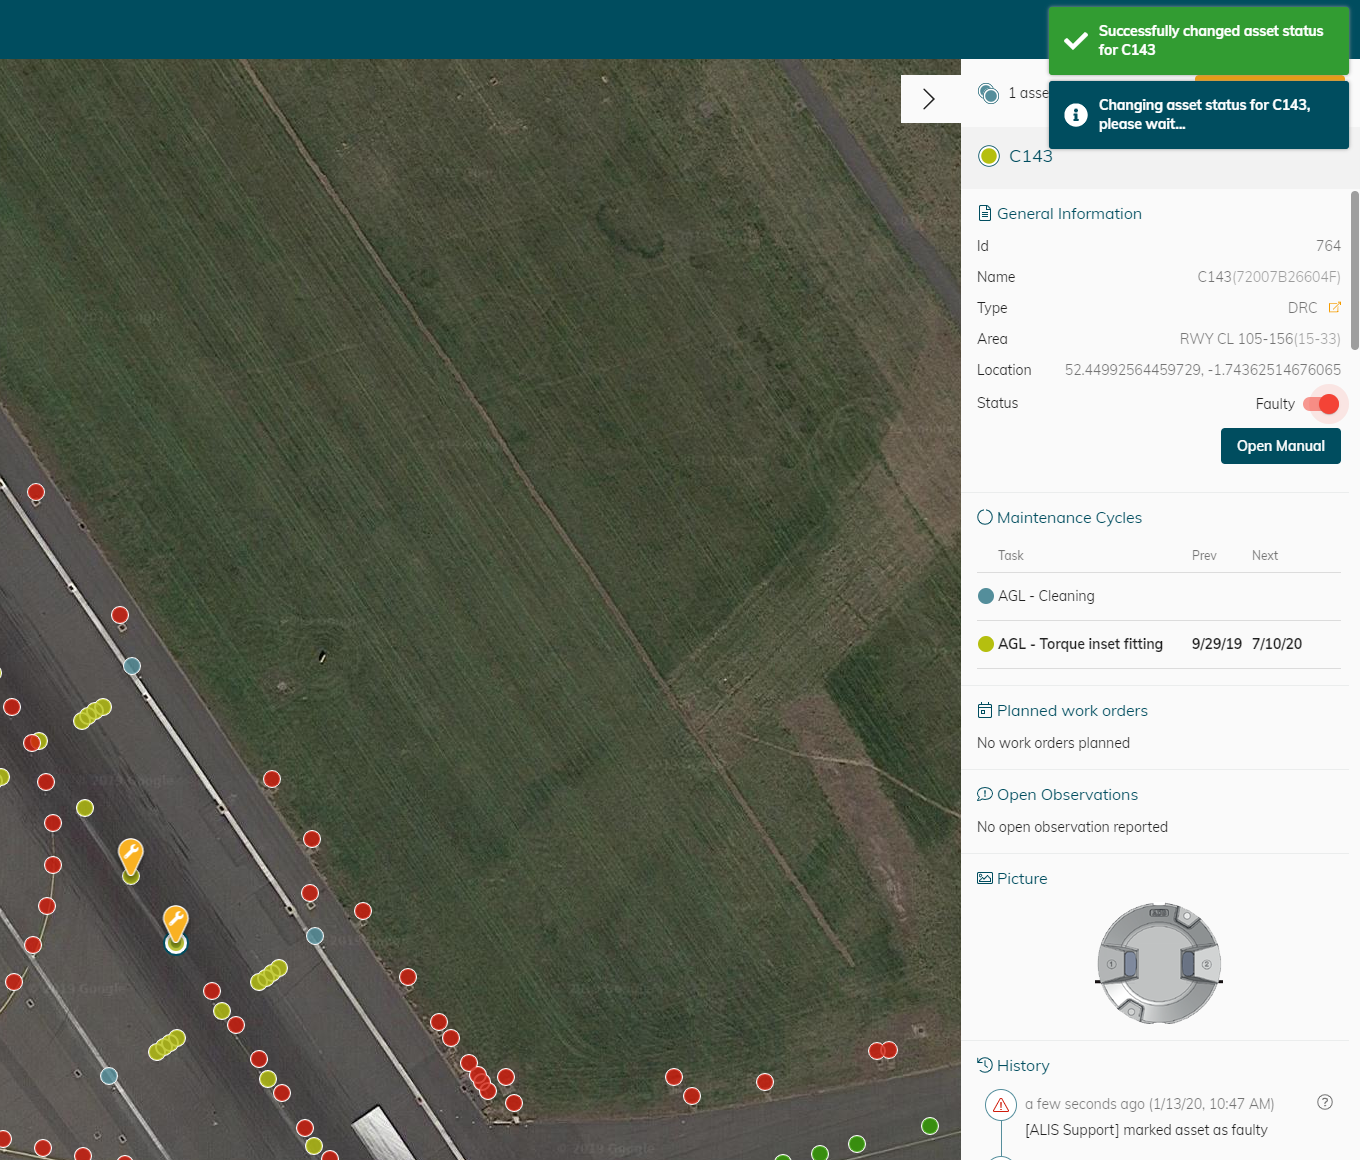
Track faulty assets
Faulty Assets are marked with a and are visible on the map.
The assets can be marked faulty from the CORTEX Service iOS and iPadOS mobile apps or CORTEX Service Team app on the mobile devices.
Assets can also be toggled Faulty / Un-Faulty by means of the toggle switch. ( This action will also be recorded in the history for auditing and referencing)
Using the Filter ASSET STATUS - will only show the faulty assets from which you can then create a work-order to replace/rectify the faulty lights - by means of the asset selection tool - CREATE WORKORDER.
Track observations made on-site
The Observation feature has received a big update - you can find out the new functions here: CORTEX Service - Observations
Whenever an observation is created on-site with CORTEX Service TEAMS app - there will be a notification in the top left corner of the webapp. 
The color will represent the worst type of observation that is reported ( Green =Minor , Orange = Major , Red = Critical)
The number represents the amount of open observations in the instance
How the reported observation looks like in CORTEX Service webapp when clicking on the notificaiton icon.
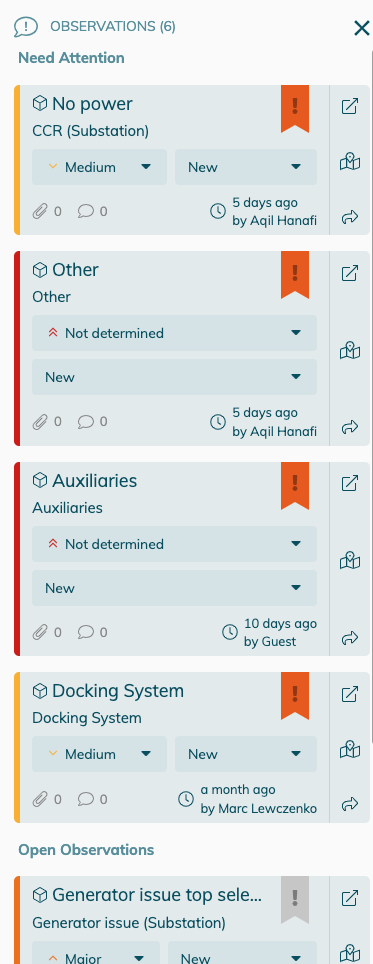
You can now perform the following actions from the Notification side bar
Icon | Action |
|---|---|
 | View the asset where the asset is linked to in the MAP. This will inform you on the location of the observation . The asset where from where the observation was created will be selected. You can now use the "create workorder" button to directly create a follow-up action on this asset. |
 | Open the details of the observation in a Pop-up Window 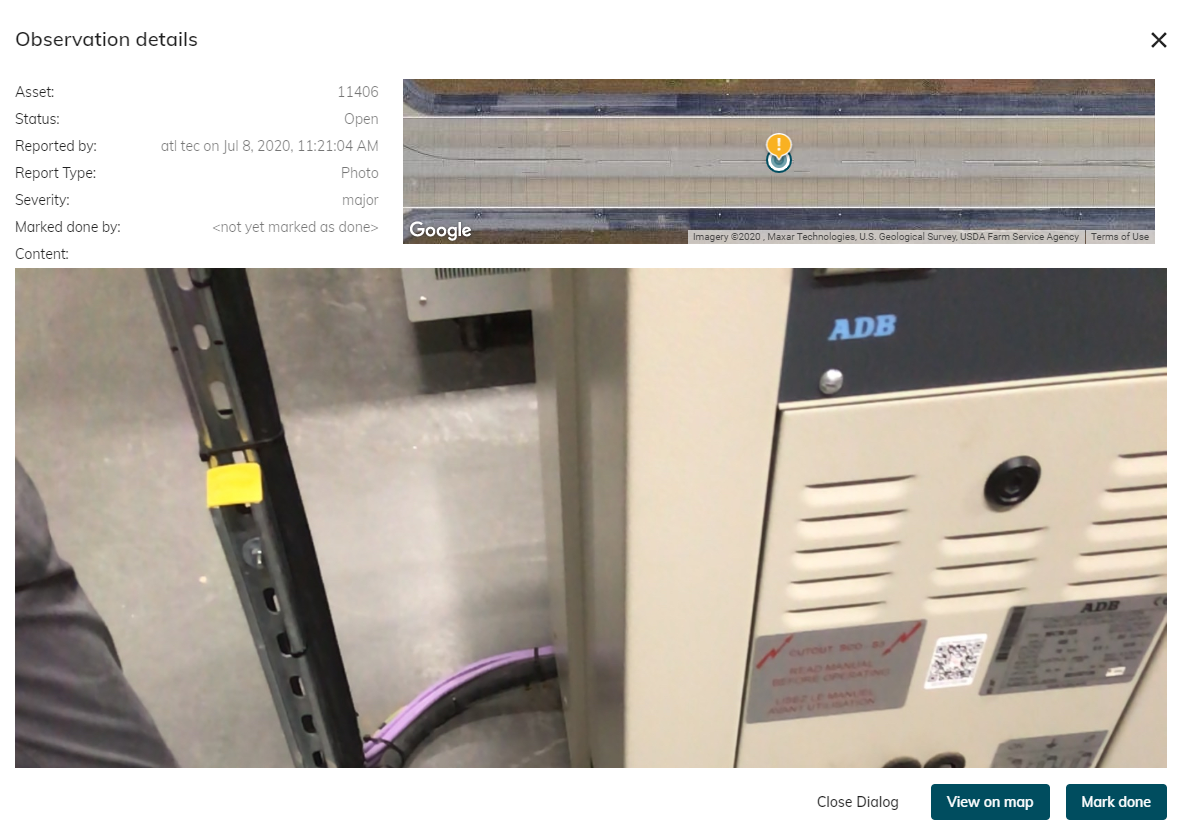 You can use the " View" on map button to see the location of the asset on the map as above. Or to directly close the observation by the "Mark as Done" button as below. |
 | Mark The observation as acknowledged and appropriate action undertaken. The observation/ticket will be closed but will remain accessible in the history. |
![]() We suggest to keep the amount of observations as low as possible (preferably 0 ) to make sure you are informed whenever an observation is reported and to be handled.
We suggest to keep the amount of observations as low as possible (preferably 0 ) to make sure you are informed whenever an observation is reported and to be handled.
Observations serve as a "ticketing" system for assets or topics that need to be highlighted. Take the necessary action through create a work order from it or another non-CORTEX Service related action and then mark the observation as "Done".
Any reported observation will remain in the system and can always be viewed again from the history detail of the assets.
By using the activity filter in combination with observation filter, you can easily find again the different type of observations that have been reported in the past.
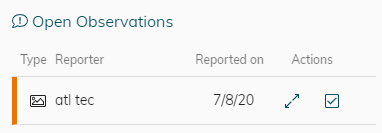
Within the asset details pane - there is a section for "open observations" . Whenever there are observations still open for an asset they will be mentioned here with the same action buttons as described above.
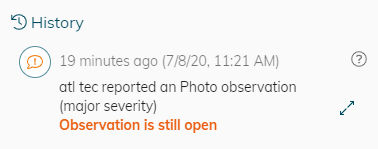
Withing the History of the asset the observation will also be stored and mention if it is still open or not.
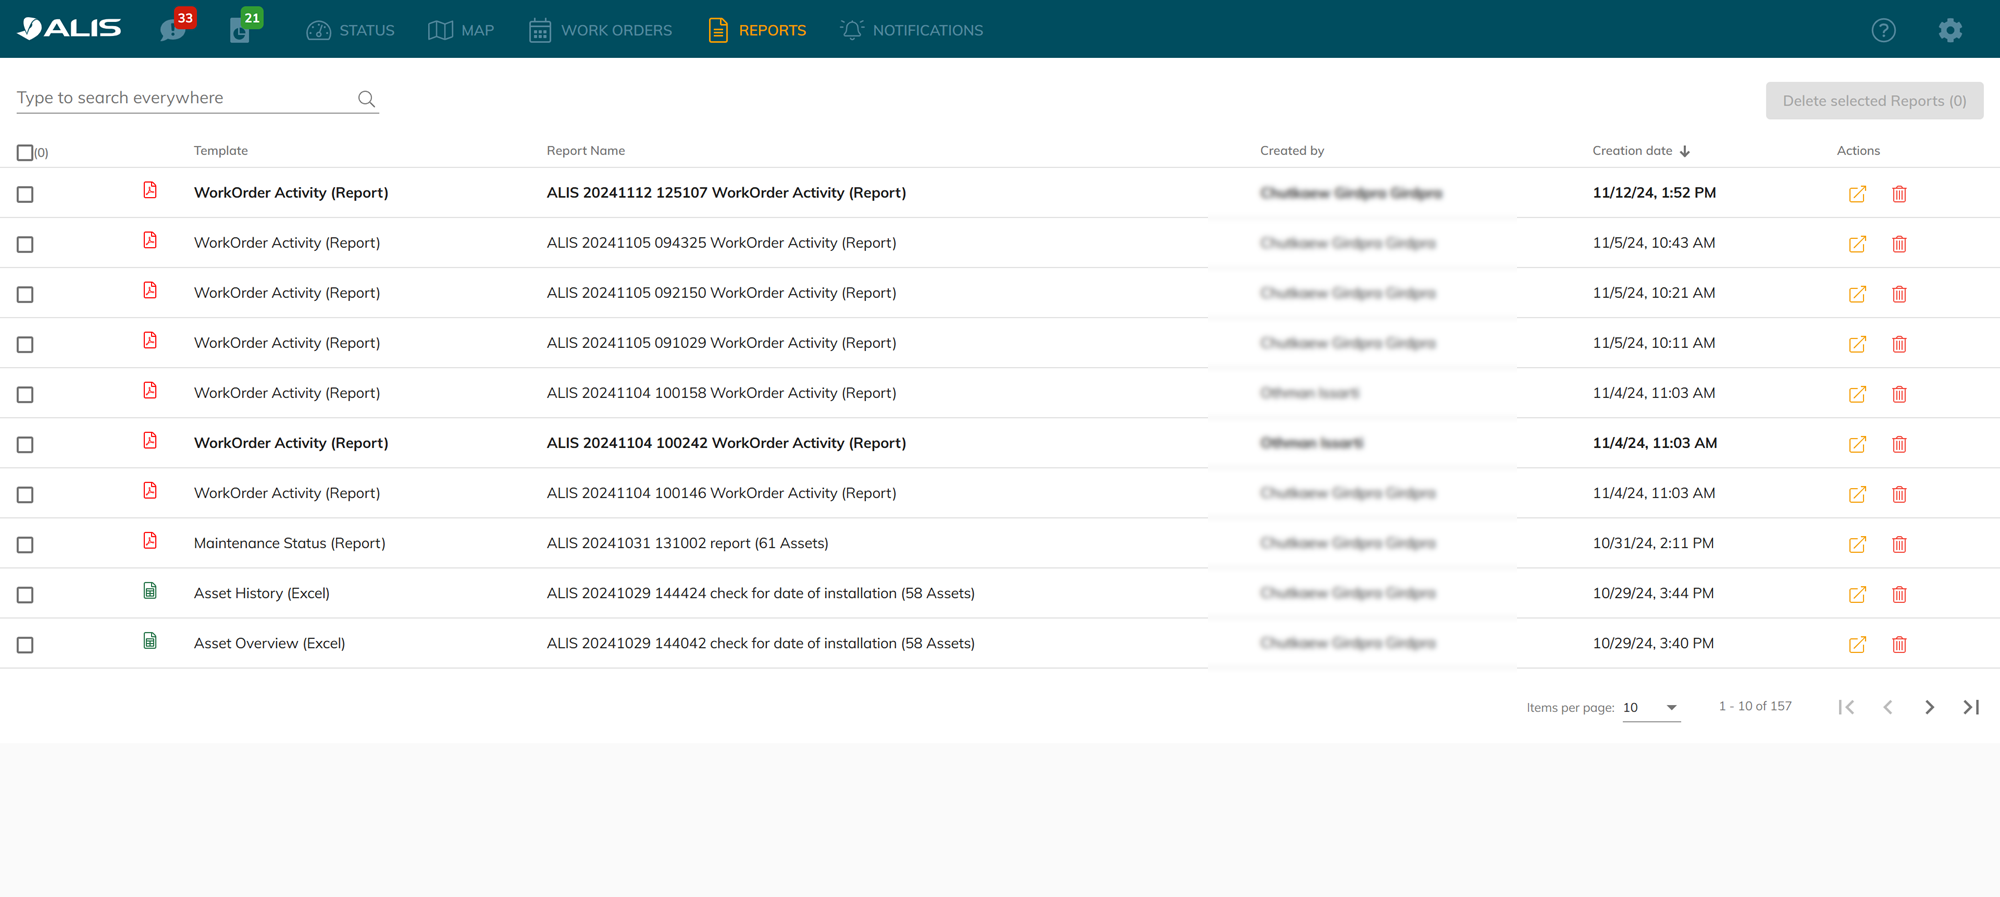
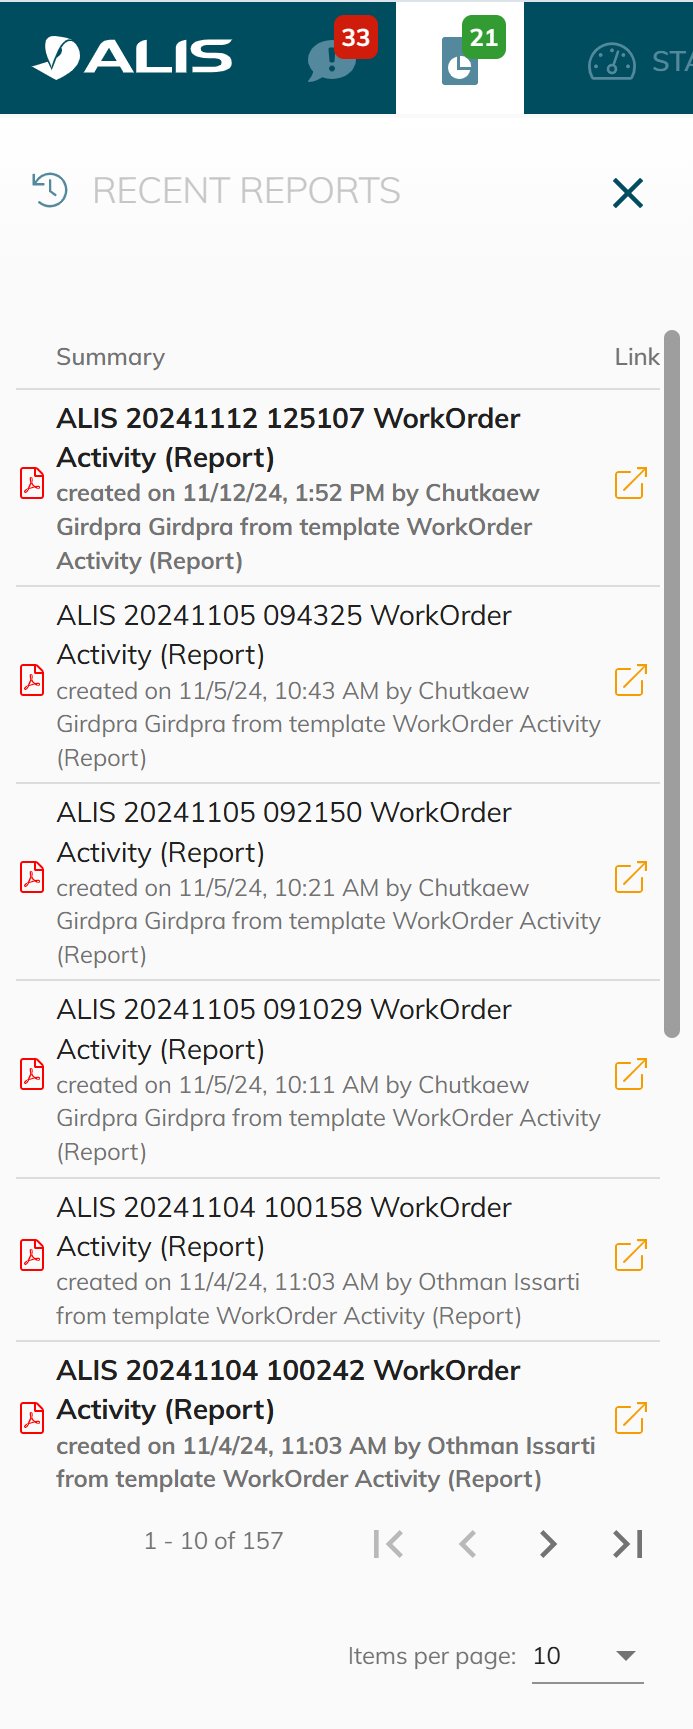
REPORTS
How to create reports on the map and from work orders can be found in our How-to articles CORTEX Service under How-to create a workorder report and How-to create a report from Assets .
Report tab
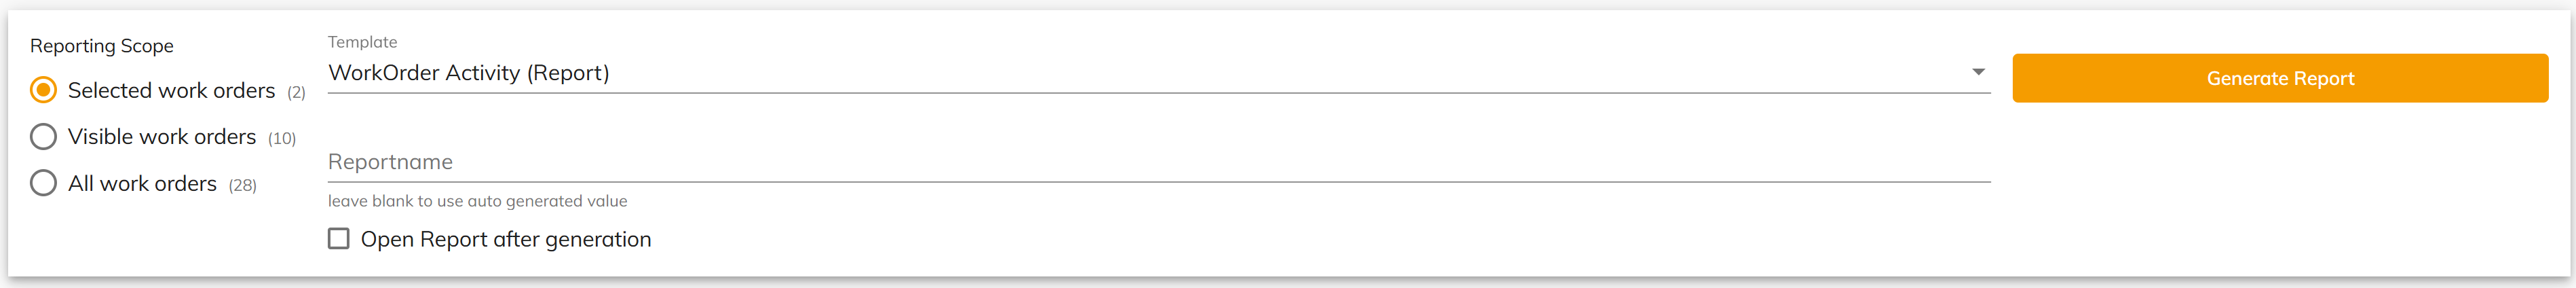
Create a report for work orders
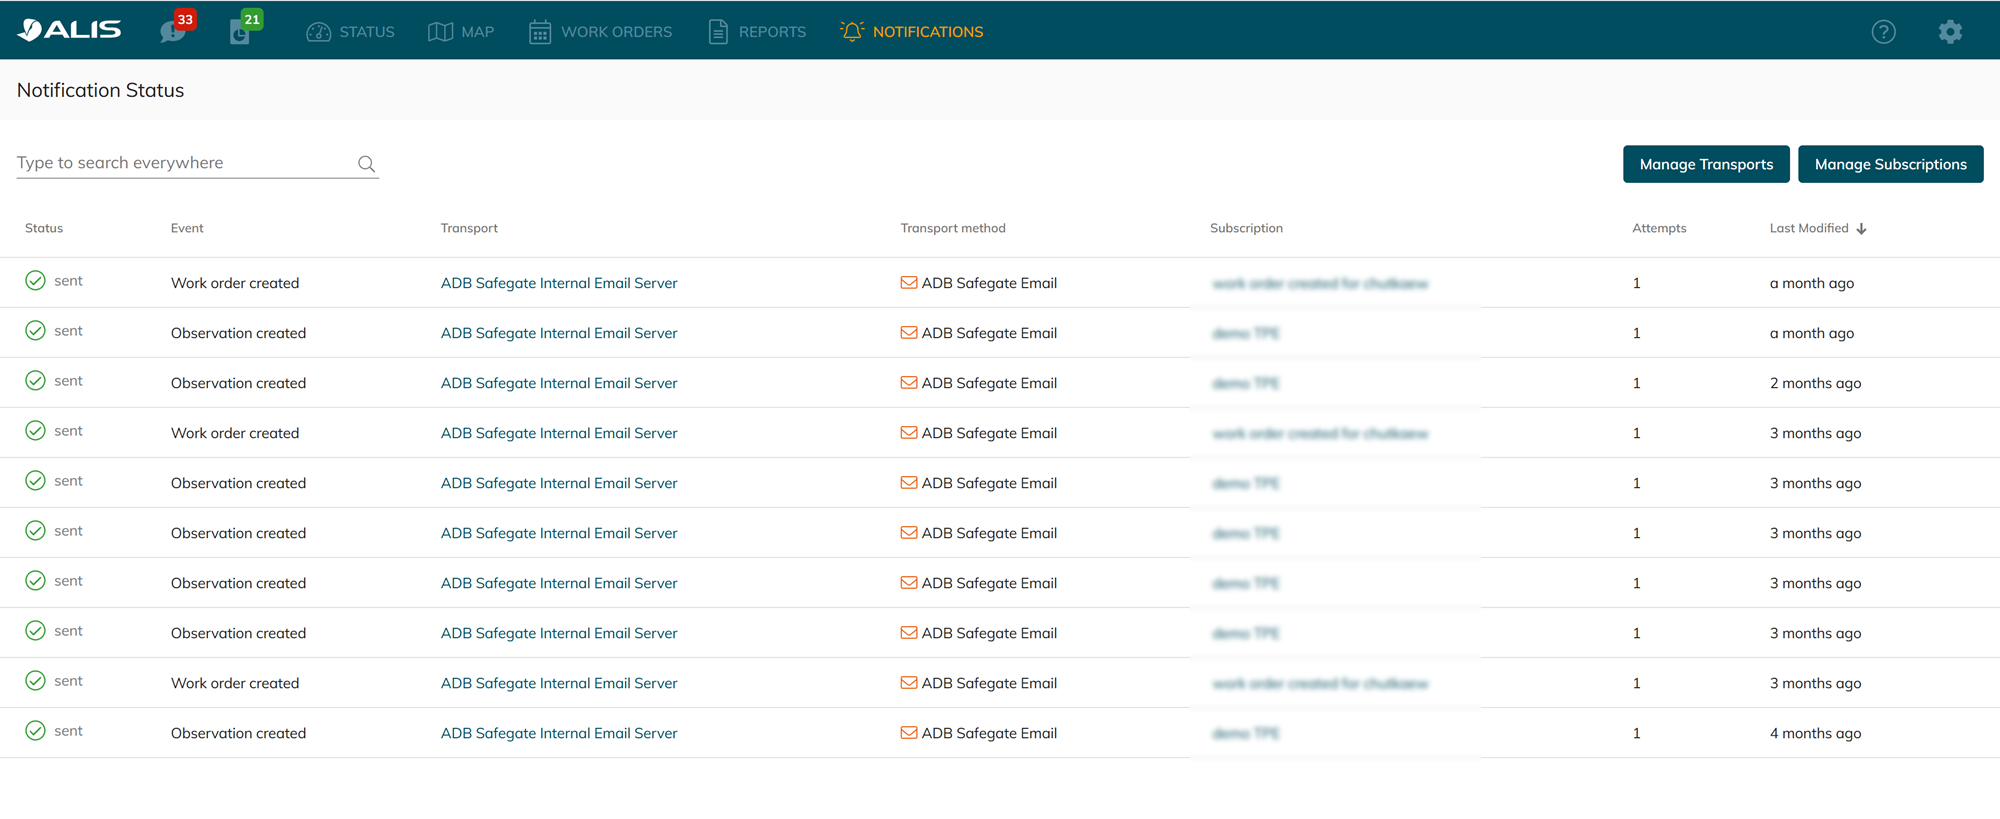
NOTIFICATIONS
This tab allows you to set up the notificiation for work orders or observations that can be sent to your emails or Teams messages. To read more about how to set up the notification system, click here
Manage the master data
Learn more on how to Add/Change/Remove assets from your CORTEX Service instance in the CORTEX Service - Asset Management import/export.