
Torque Analysis - Free Power Bi Template
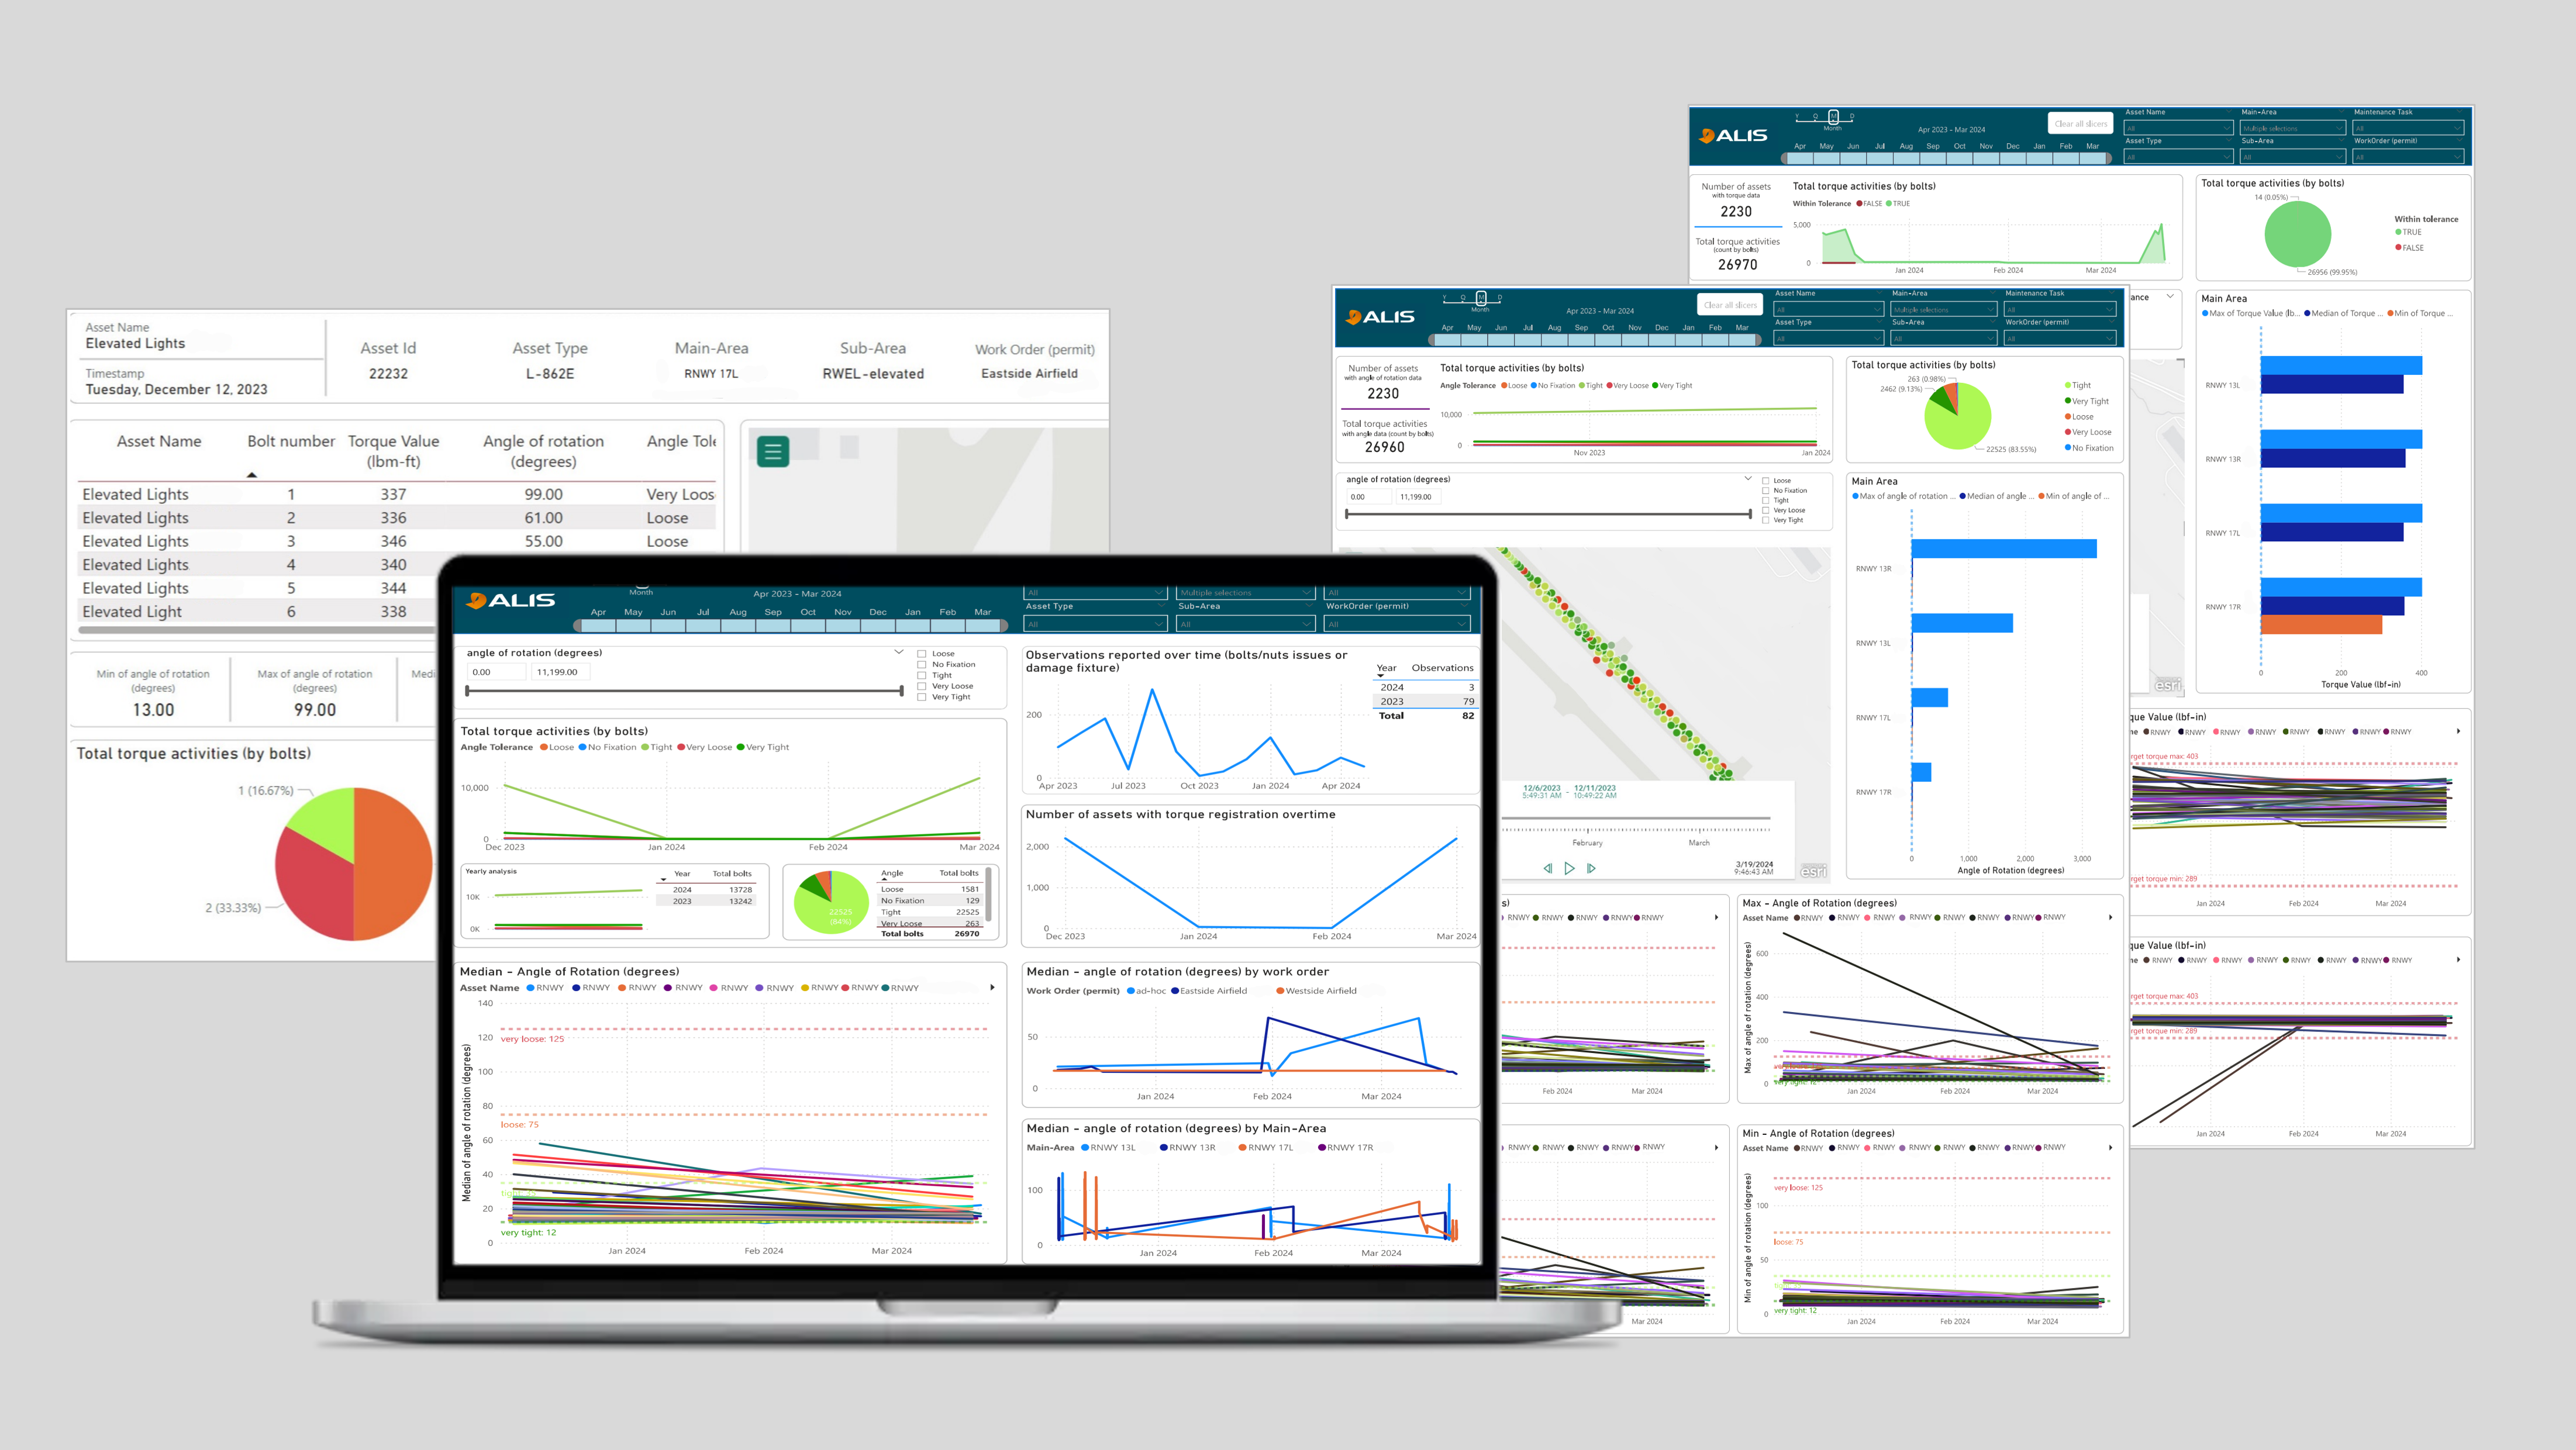
You will be able to see your airport’s torque data and a full timeline of torque analysis in Power Bi by simply download the template provided and import the data from CORTEX Service (asset history and obsevation files). The template can be modified however you like and it’s FREE for all CORTEX Service users.
What can you gain from this data?
Full timeline of your torque data
The amount of bolts or assets torqued in the past
Optimization of maintenance regime
Safety improvement
Torque values and angle of rotation analysis
What do you need to get started?
To get the asset history file, you have to log into your CORTEX Service instance and create a report. It is recommended to generate a report for all assets to see all torque data within your instance.
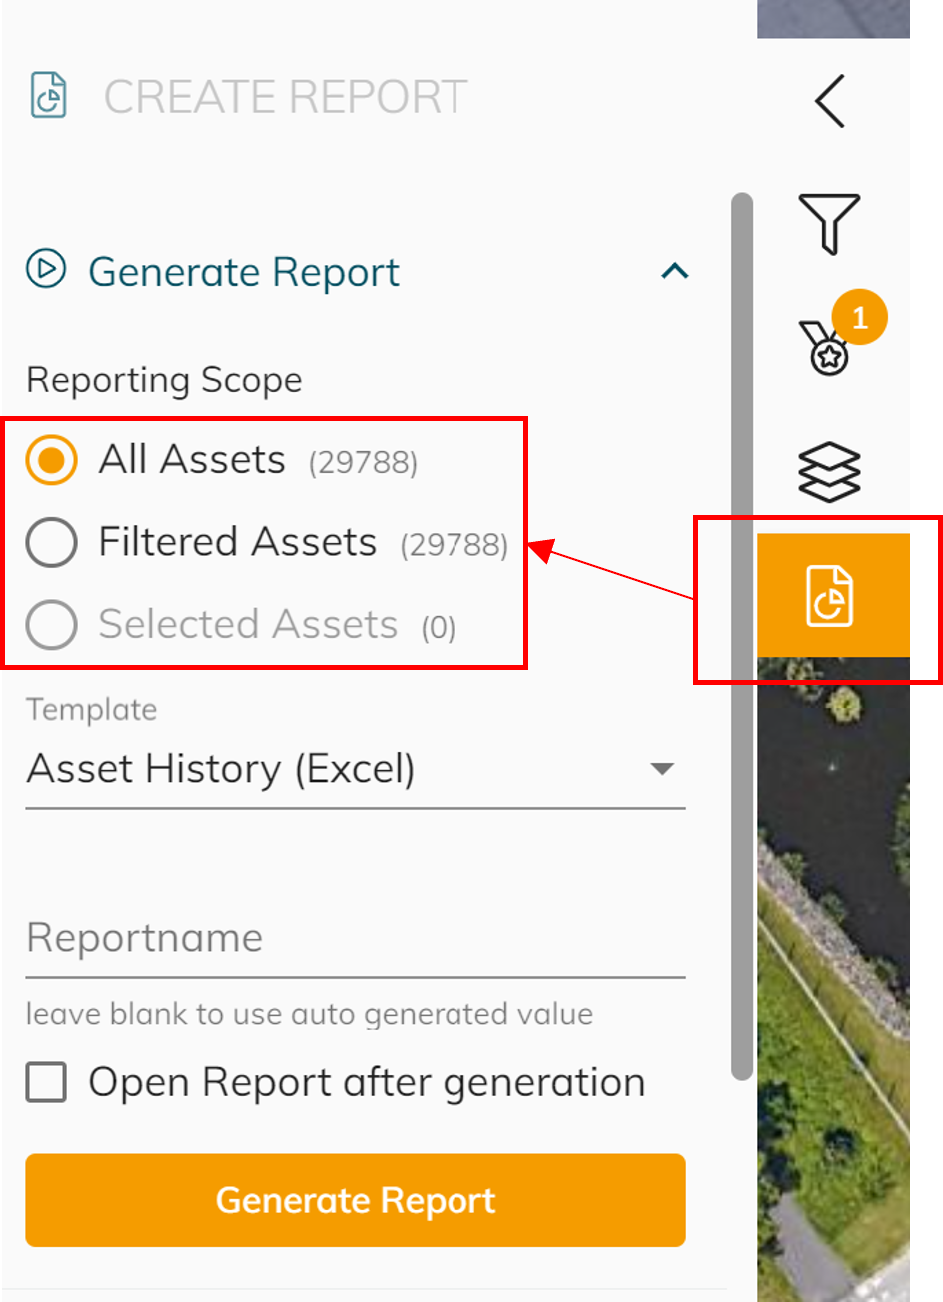
Choose the asset history report
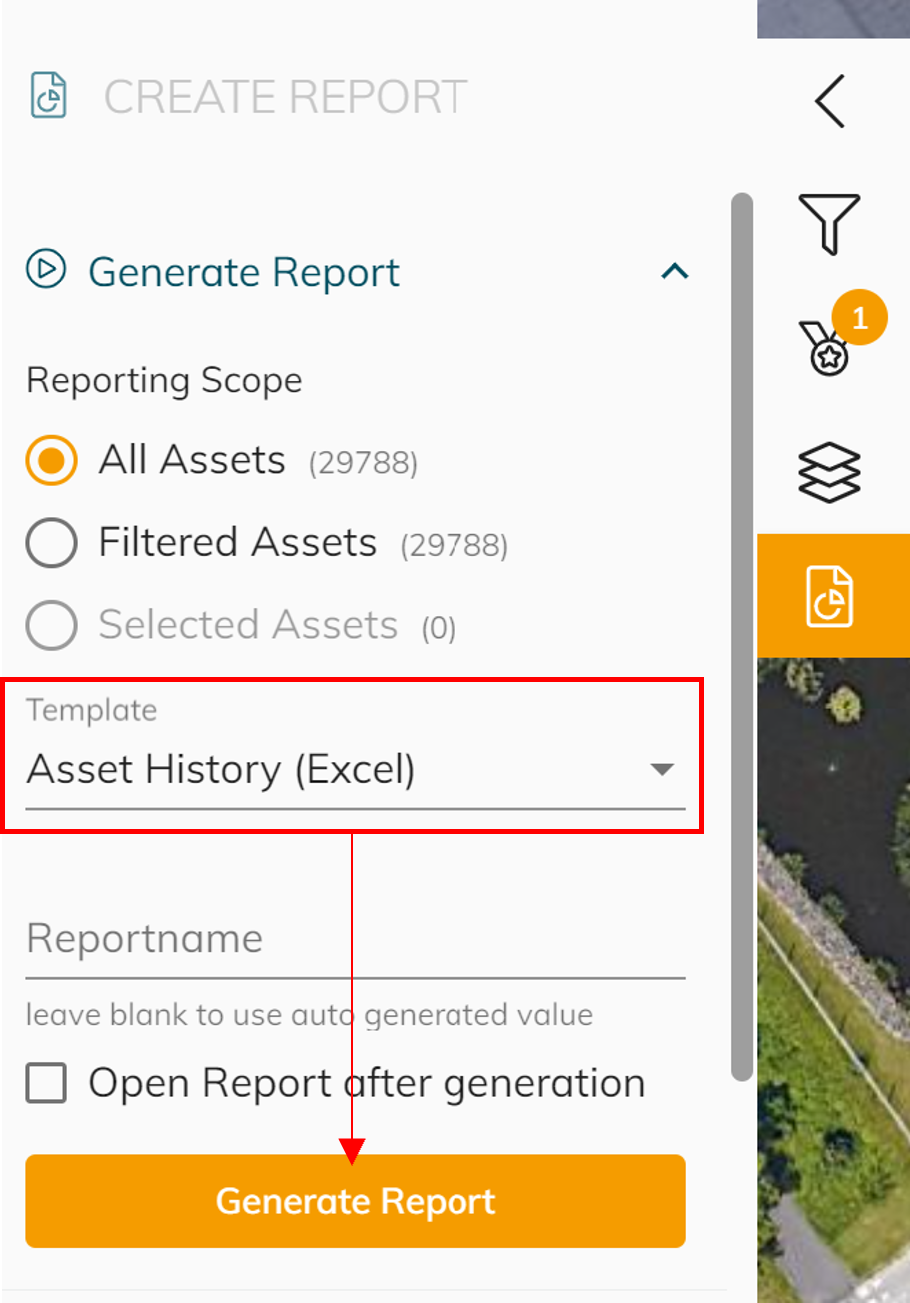
See example of what your file should look like in the template zip file
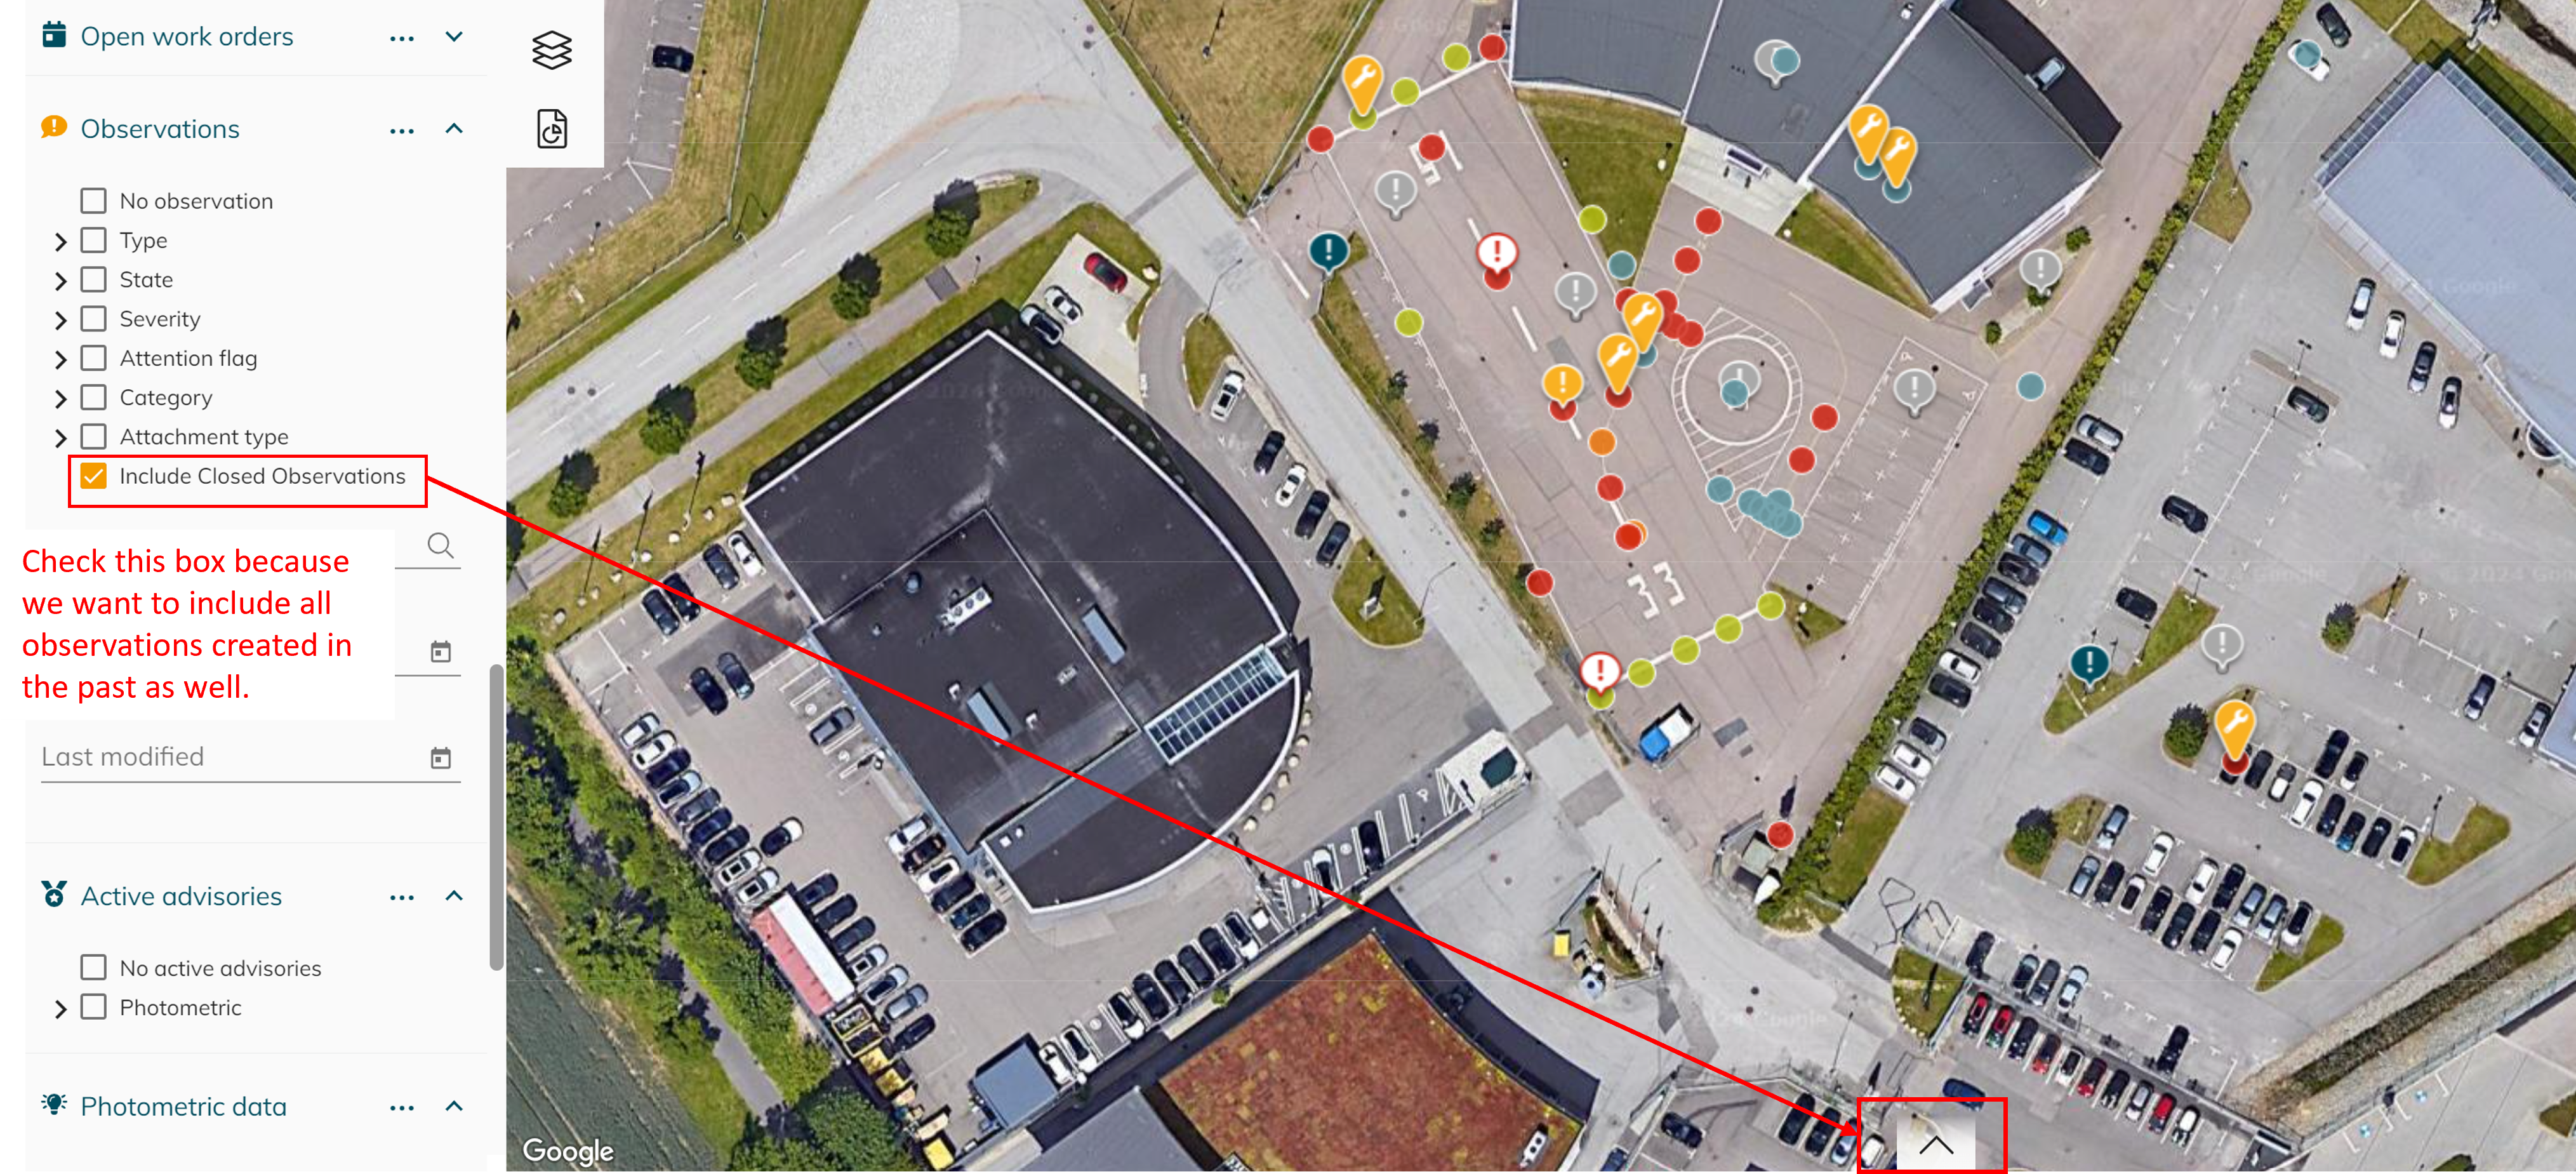
To obtain the observation file, you would have to log into CORTEX Service. Go to the filter on the left panel and choose include Closed Obsevations (this will allow you to see datas from both open and closed observations).
Click the arrow at the bottom of the page to bring up a table.
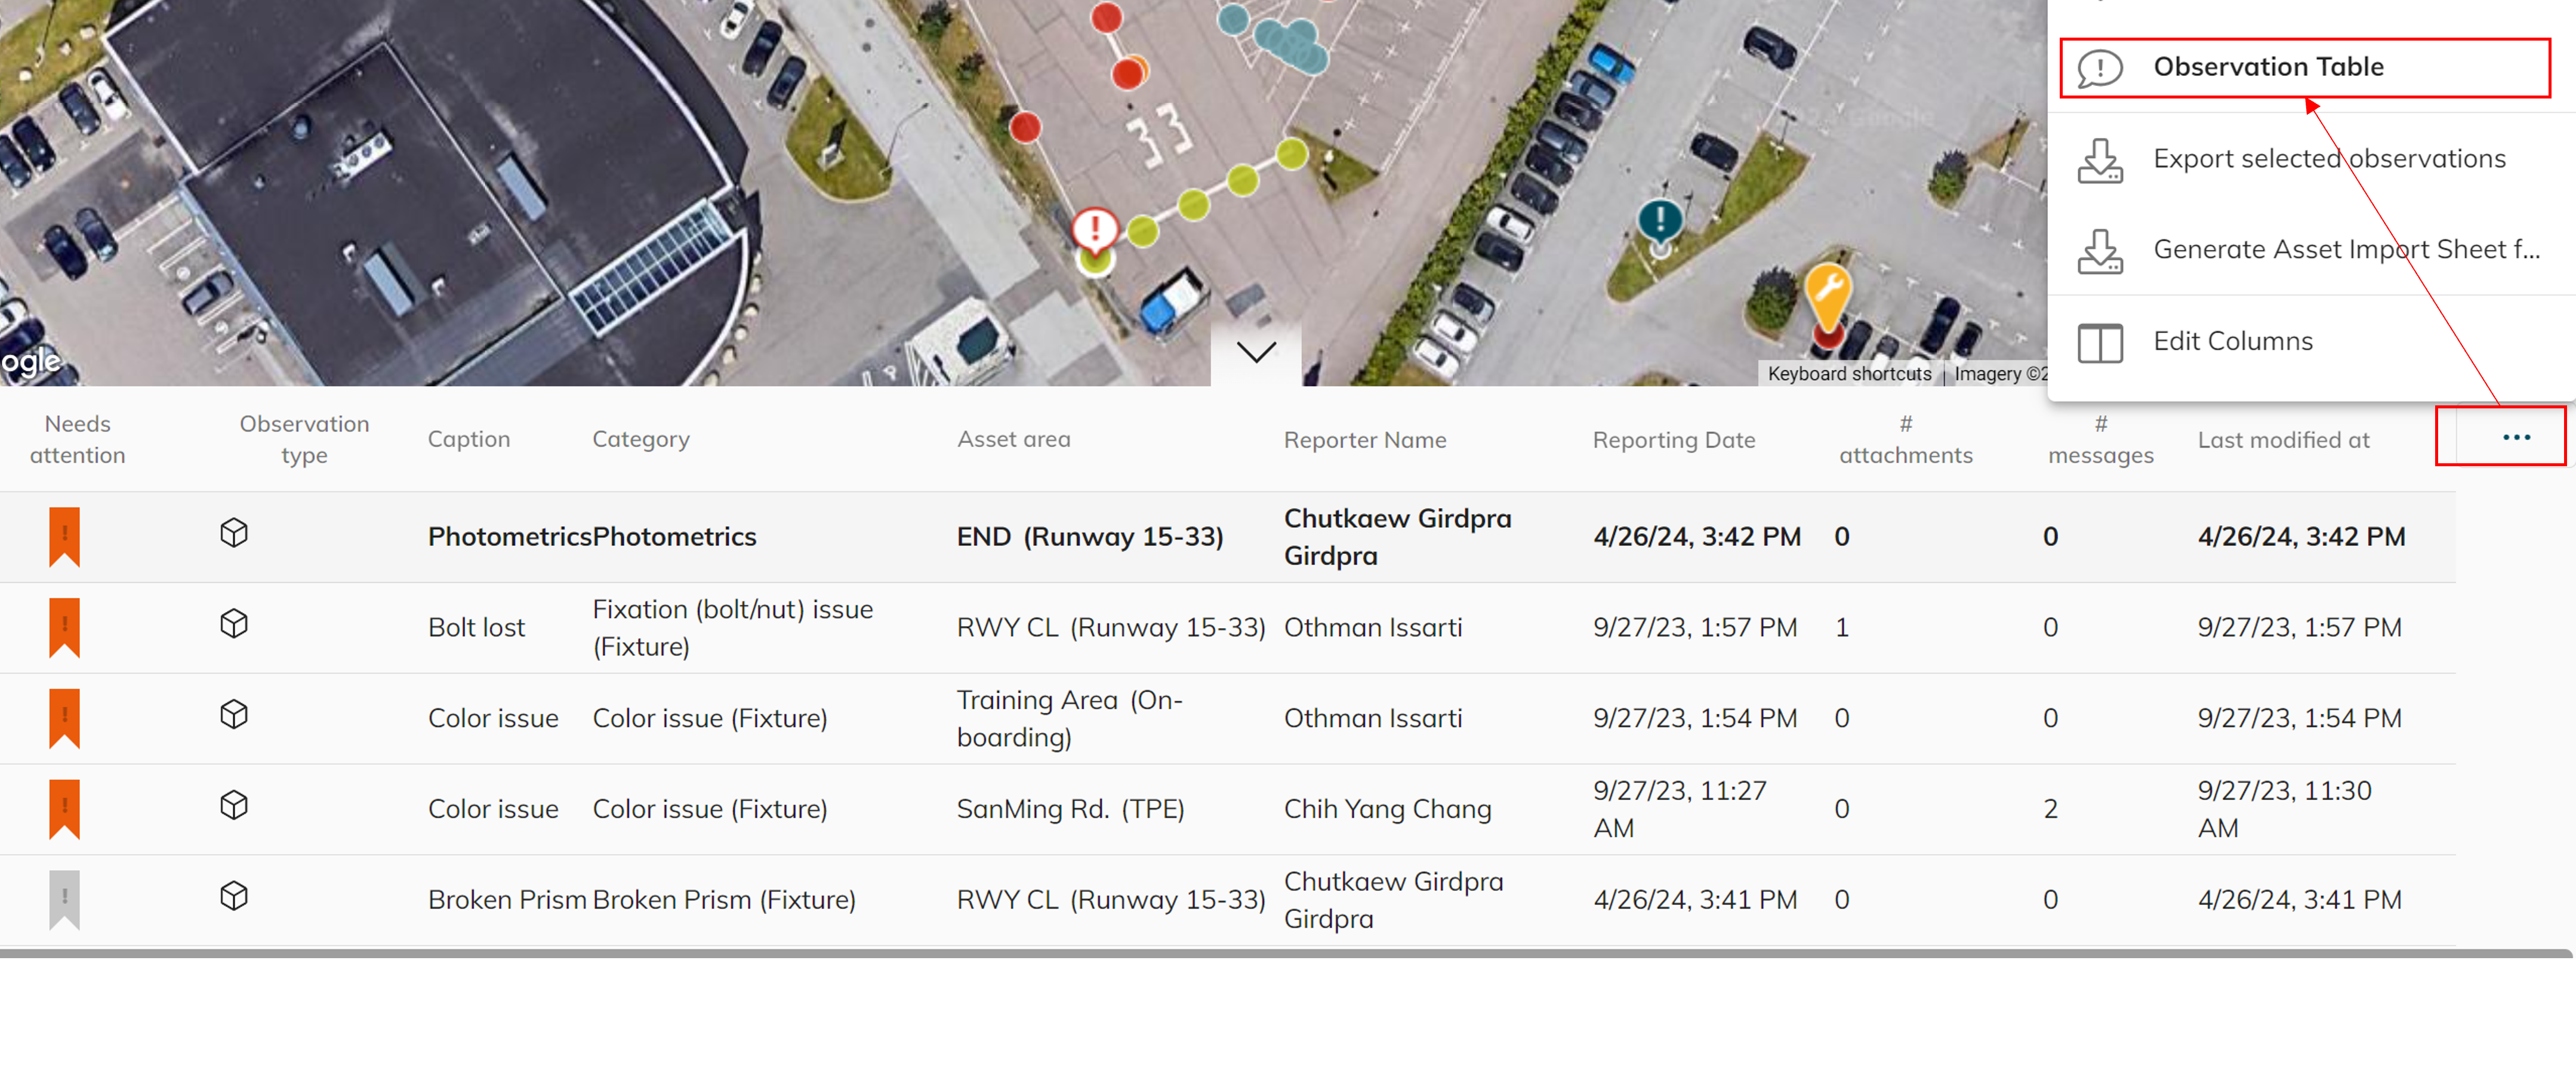
By default, the table should show the asset table. You have to change it to the Observation by clicking on the 3 dots and click on Observation Table.
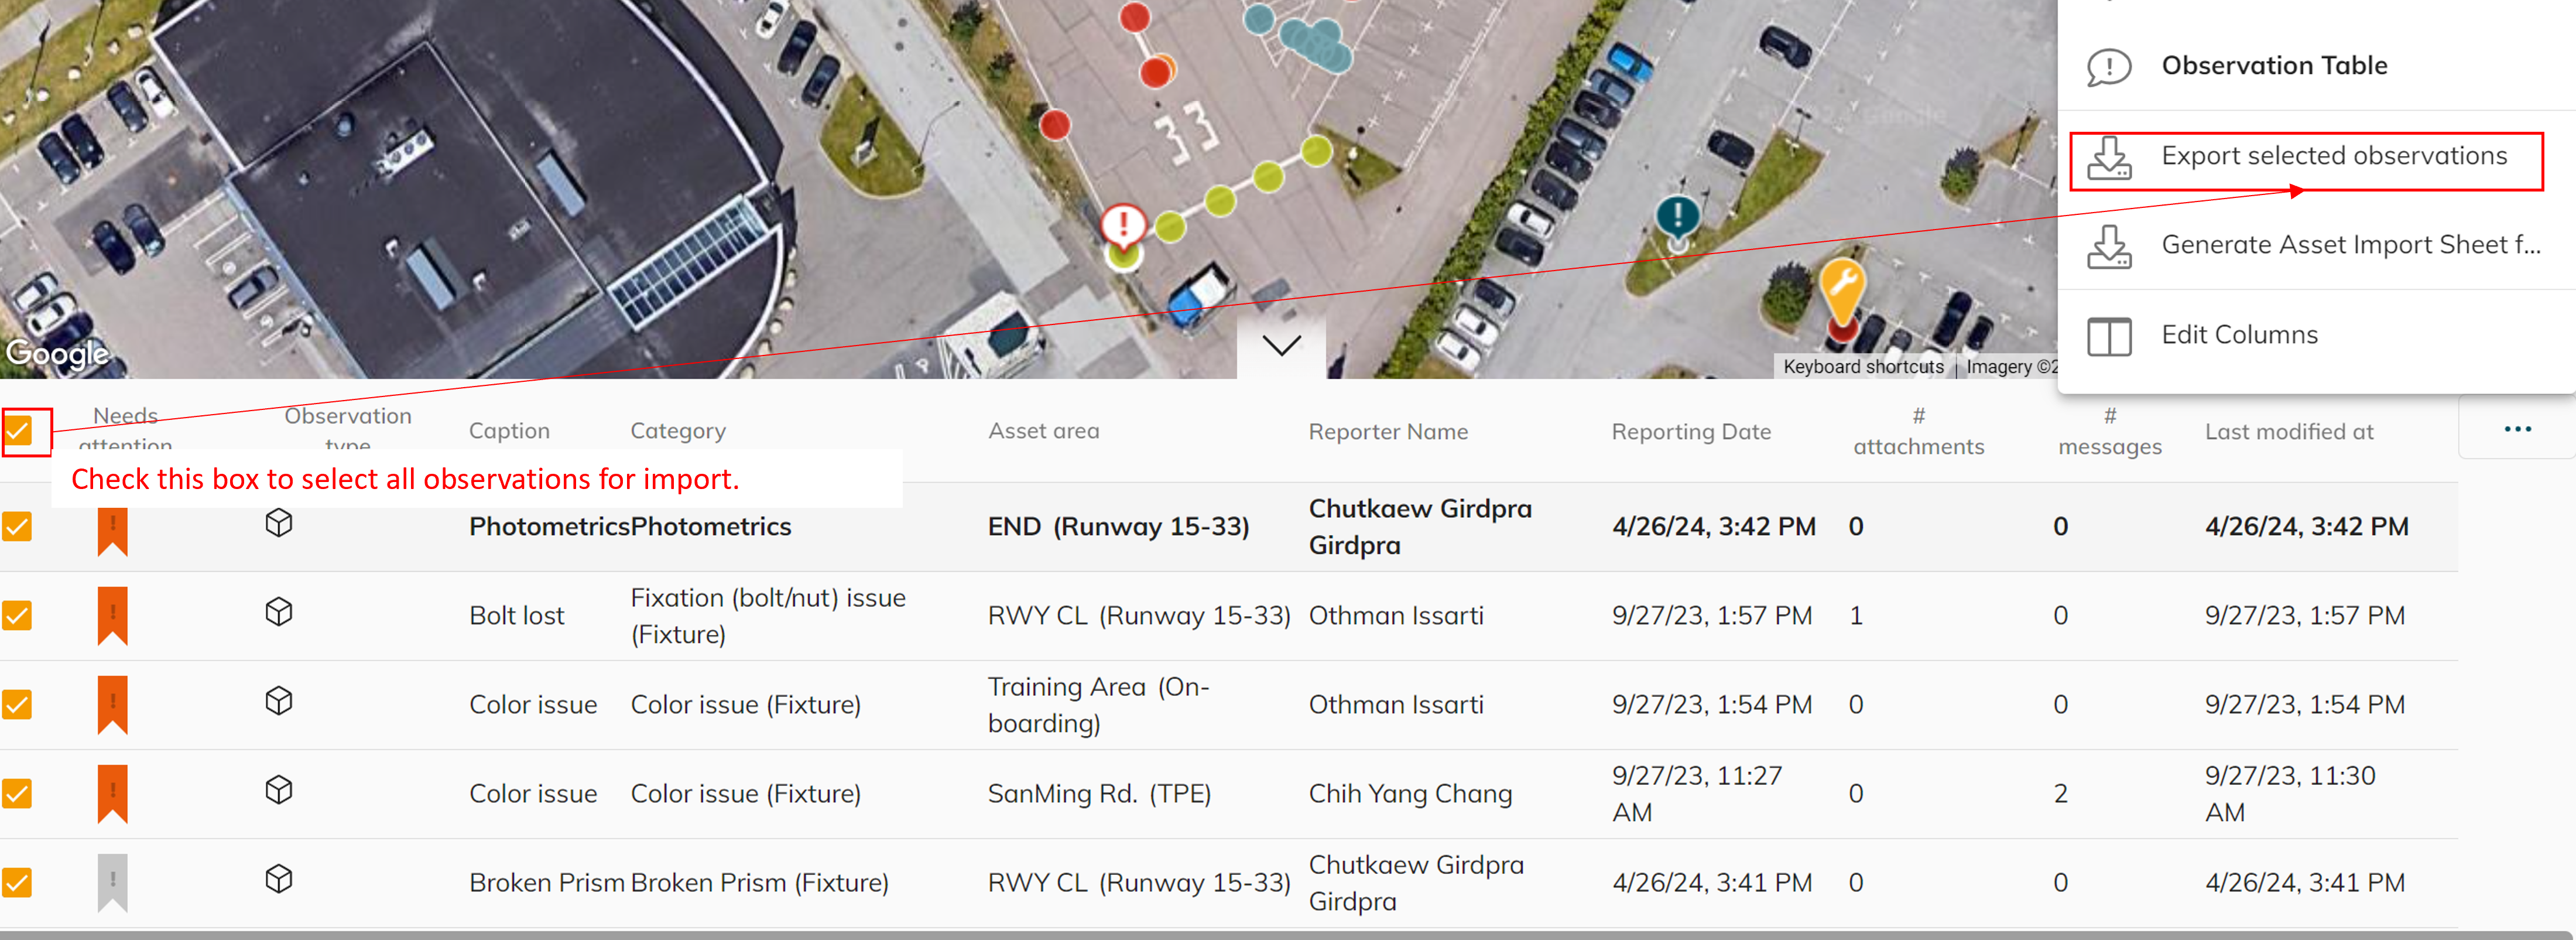
Check the top box to select all observations and click the 3 dots […] to export selected observations. This way you should obtain an excel file.
See example in the template zip file
Step-by-step guide on how to import torque data into Power Bi
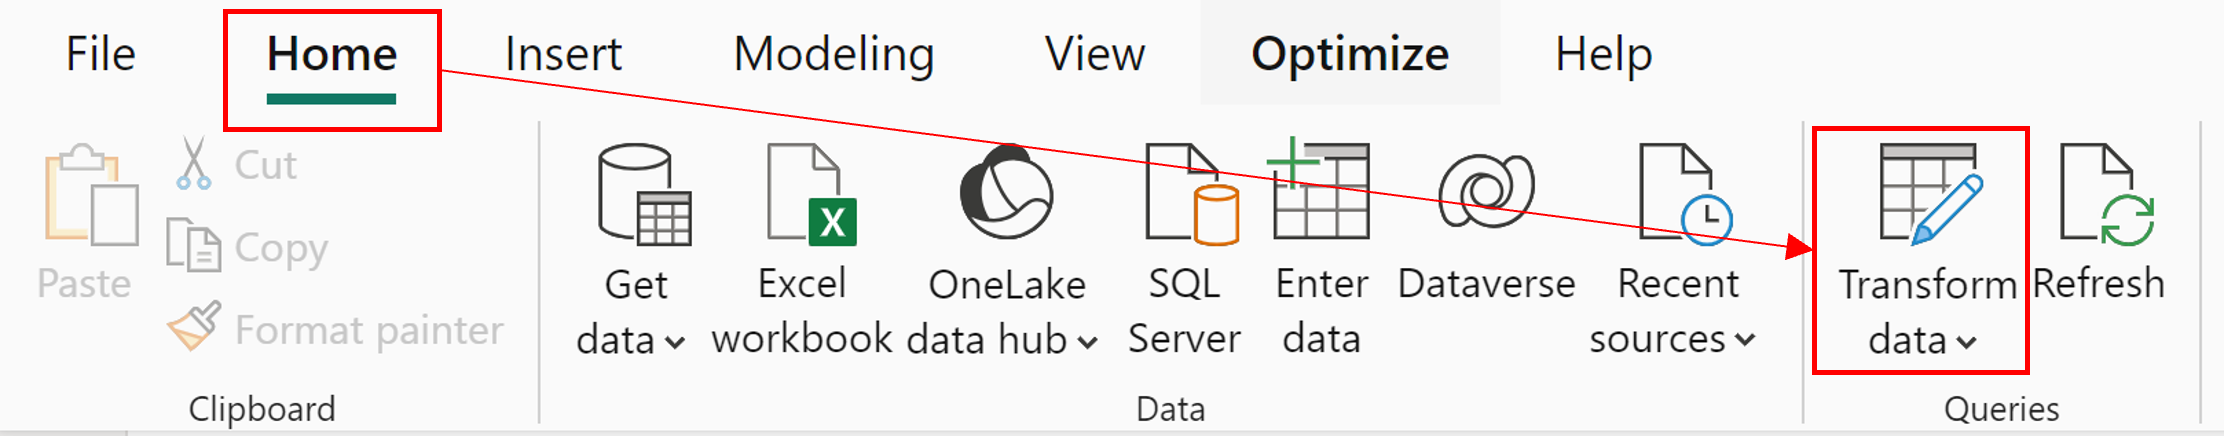
Unzip the file first then open the Power Bi template file and click on Transform data under the Home tab
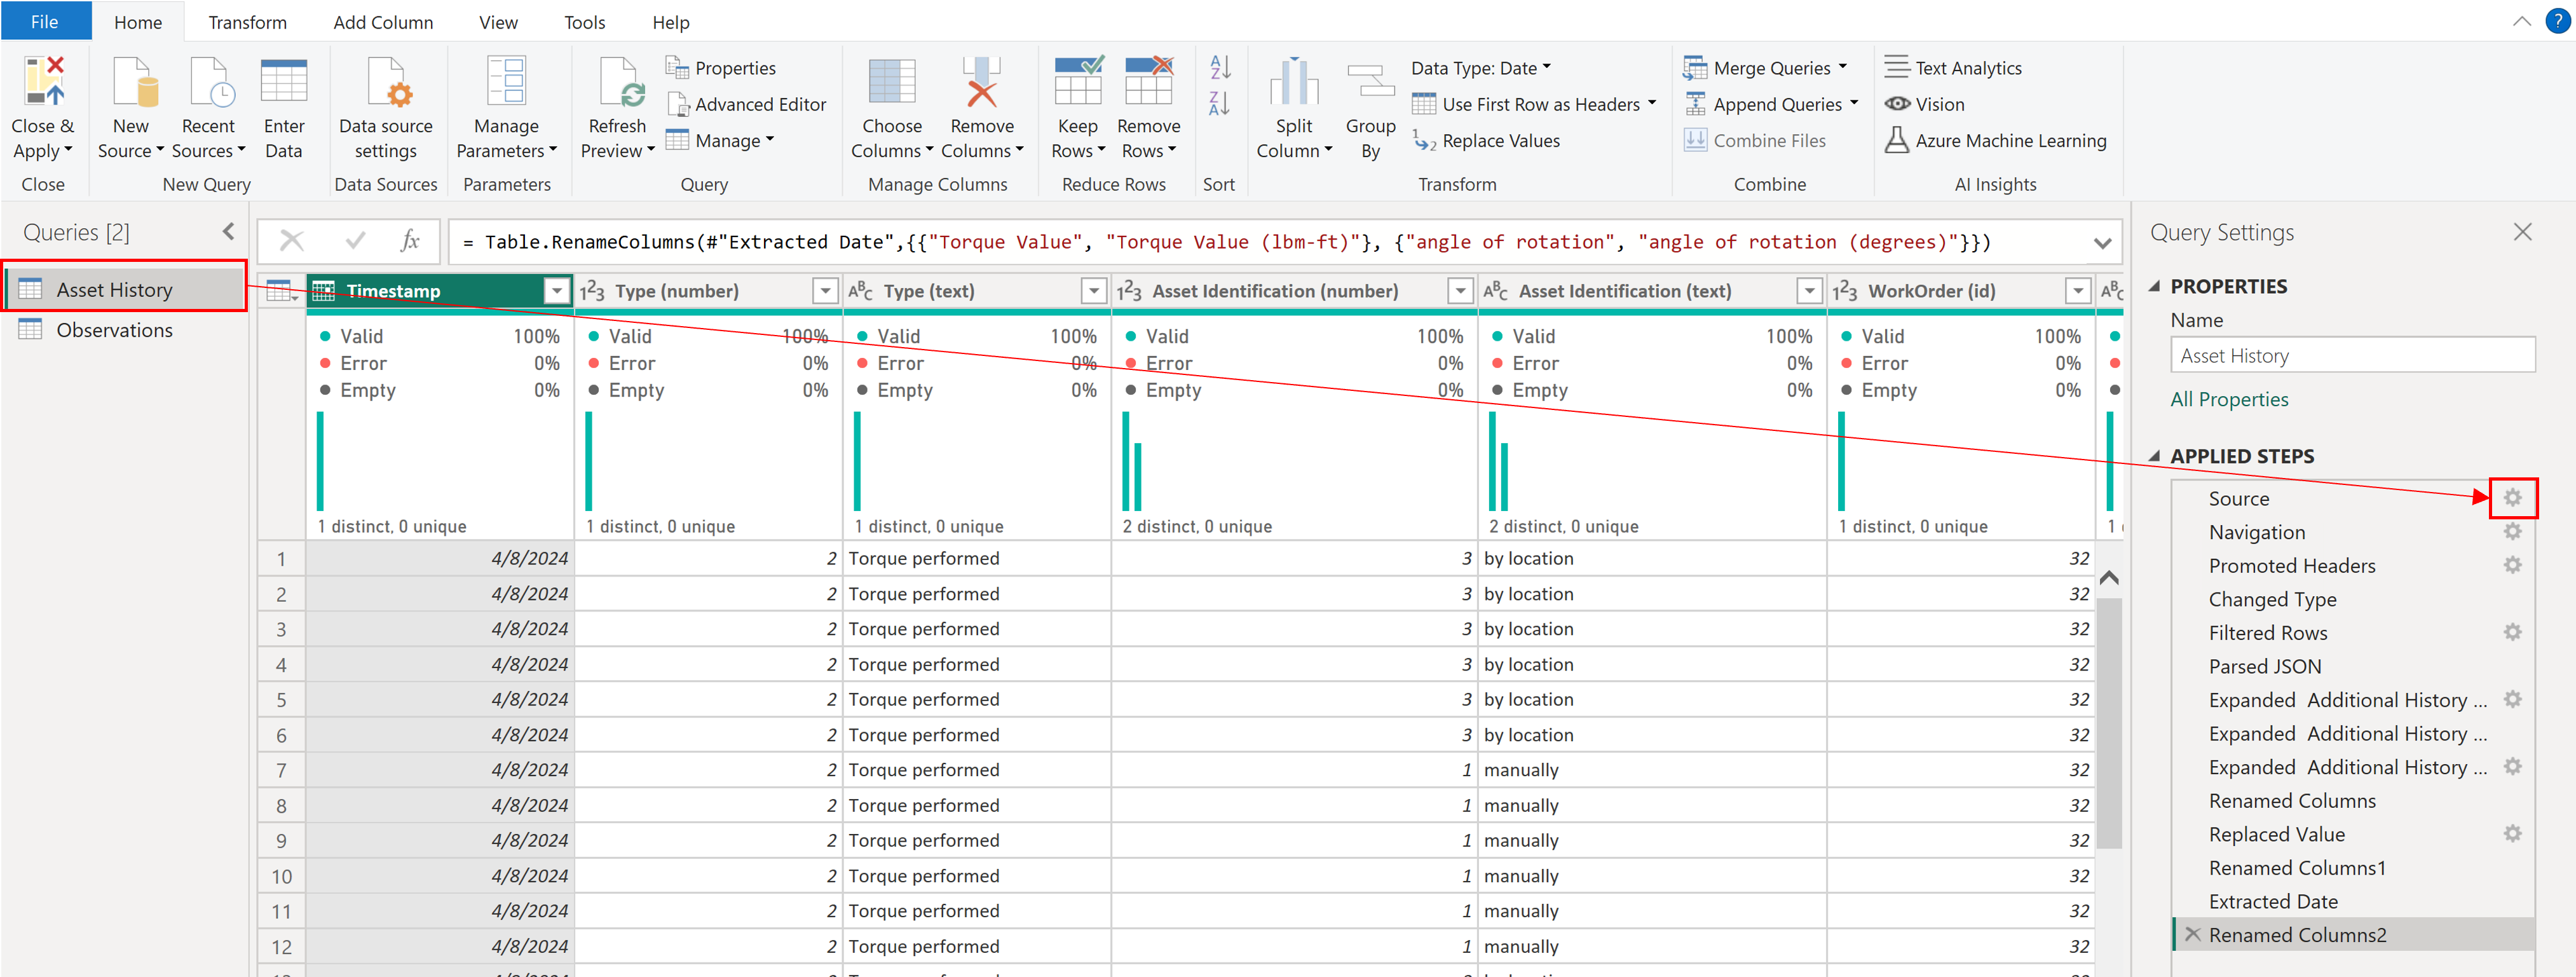
Select Asset History and click on the the small gear next to Source
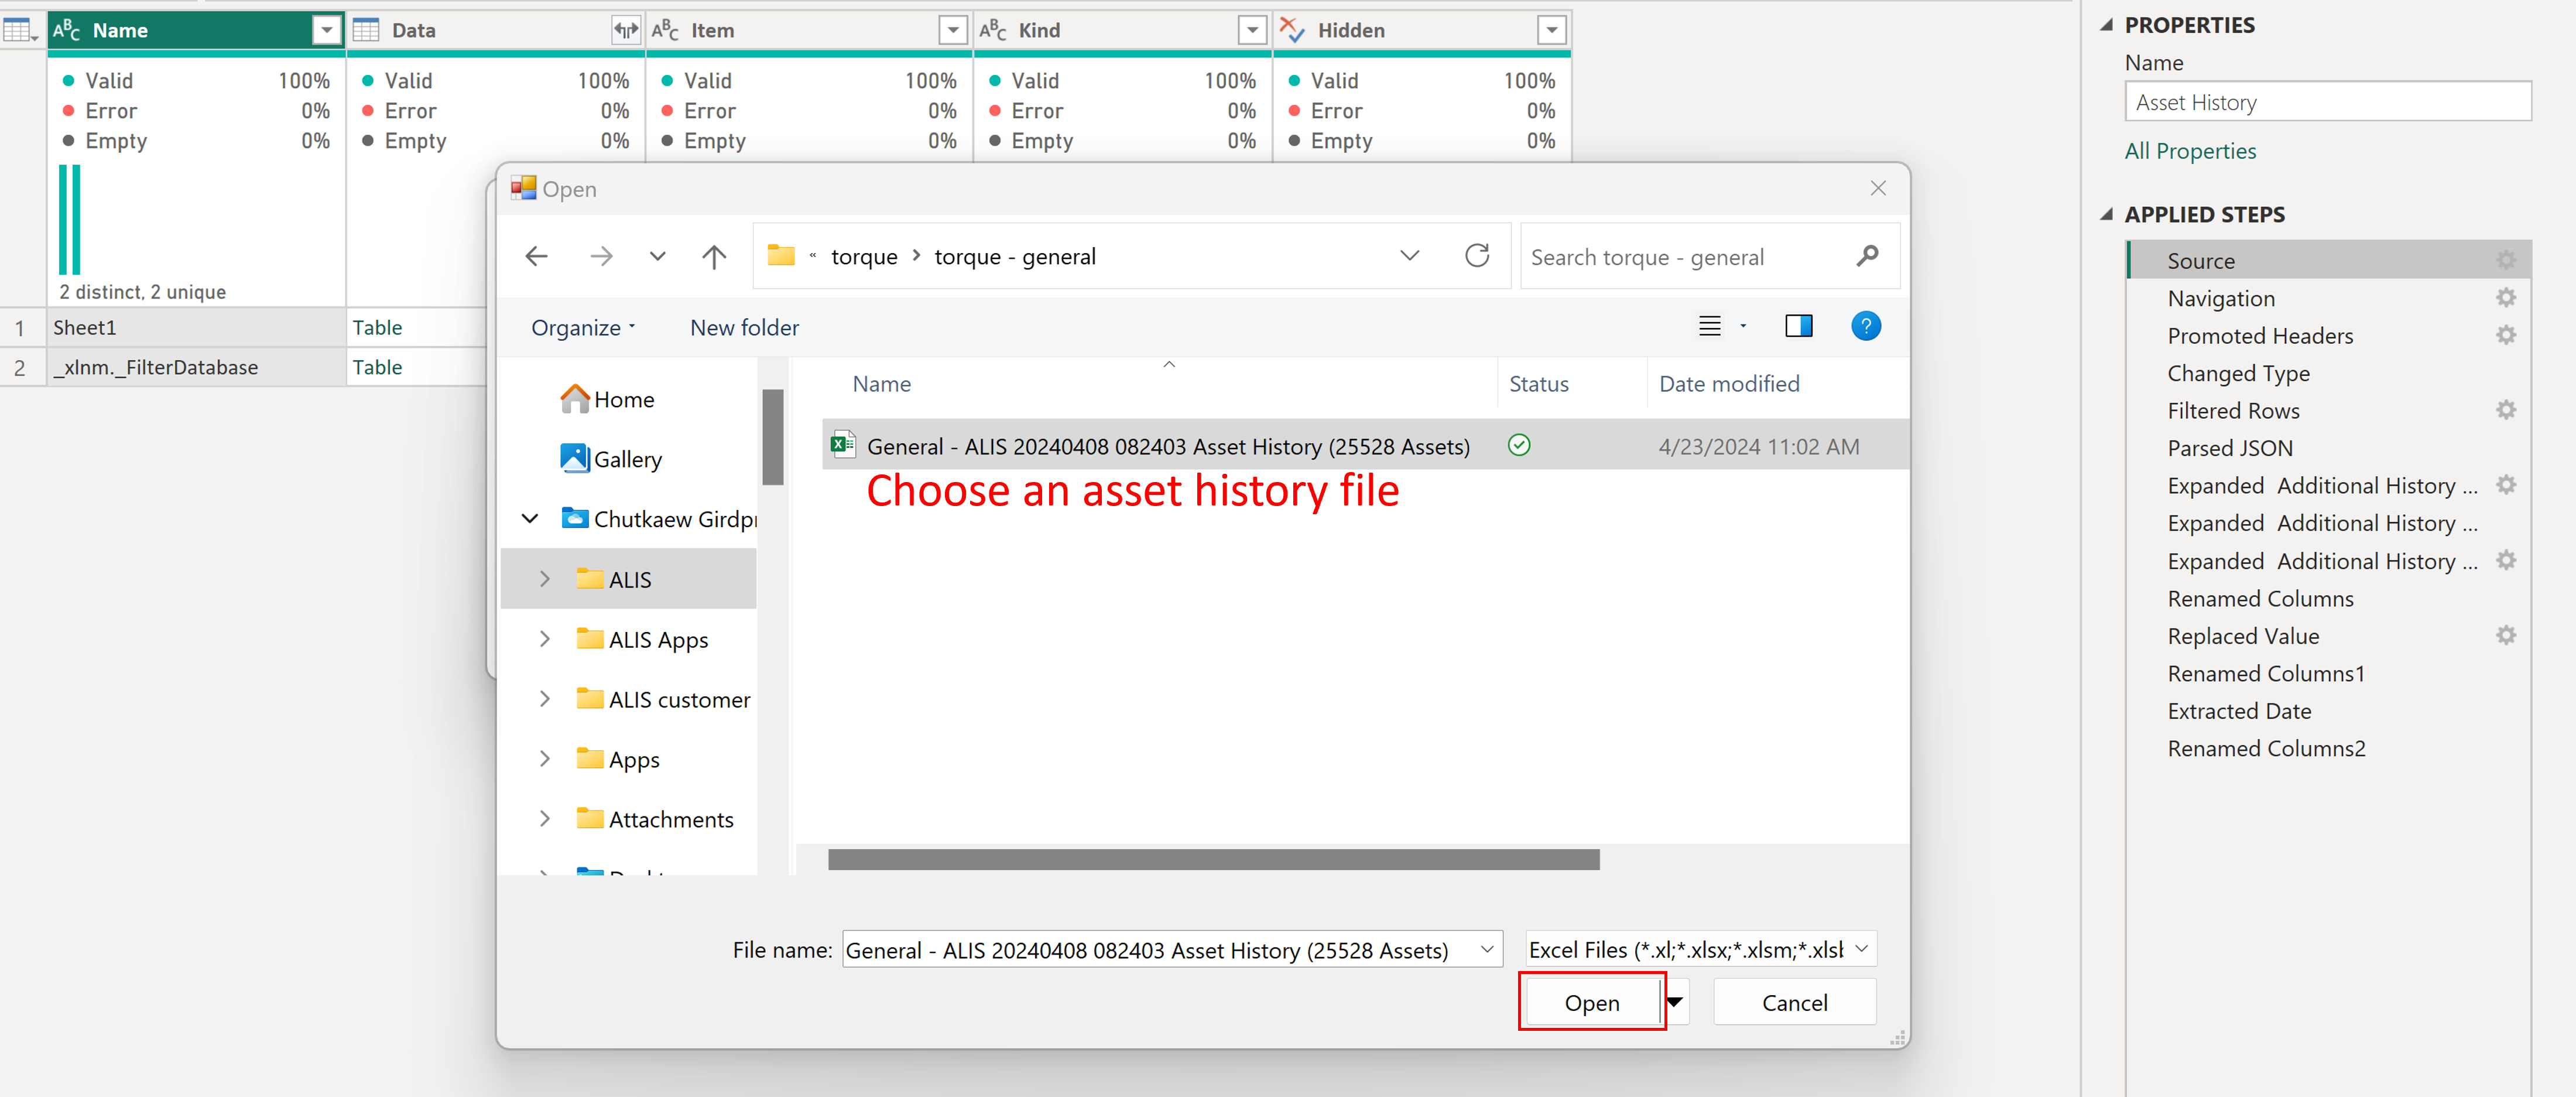
Click Browse…
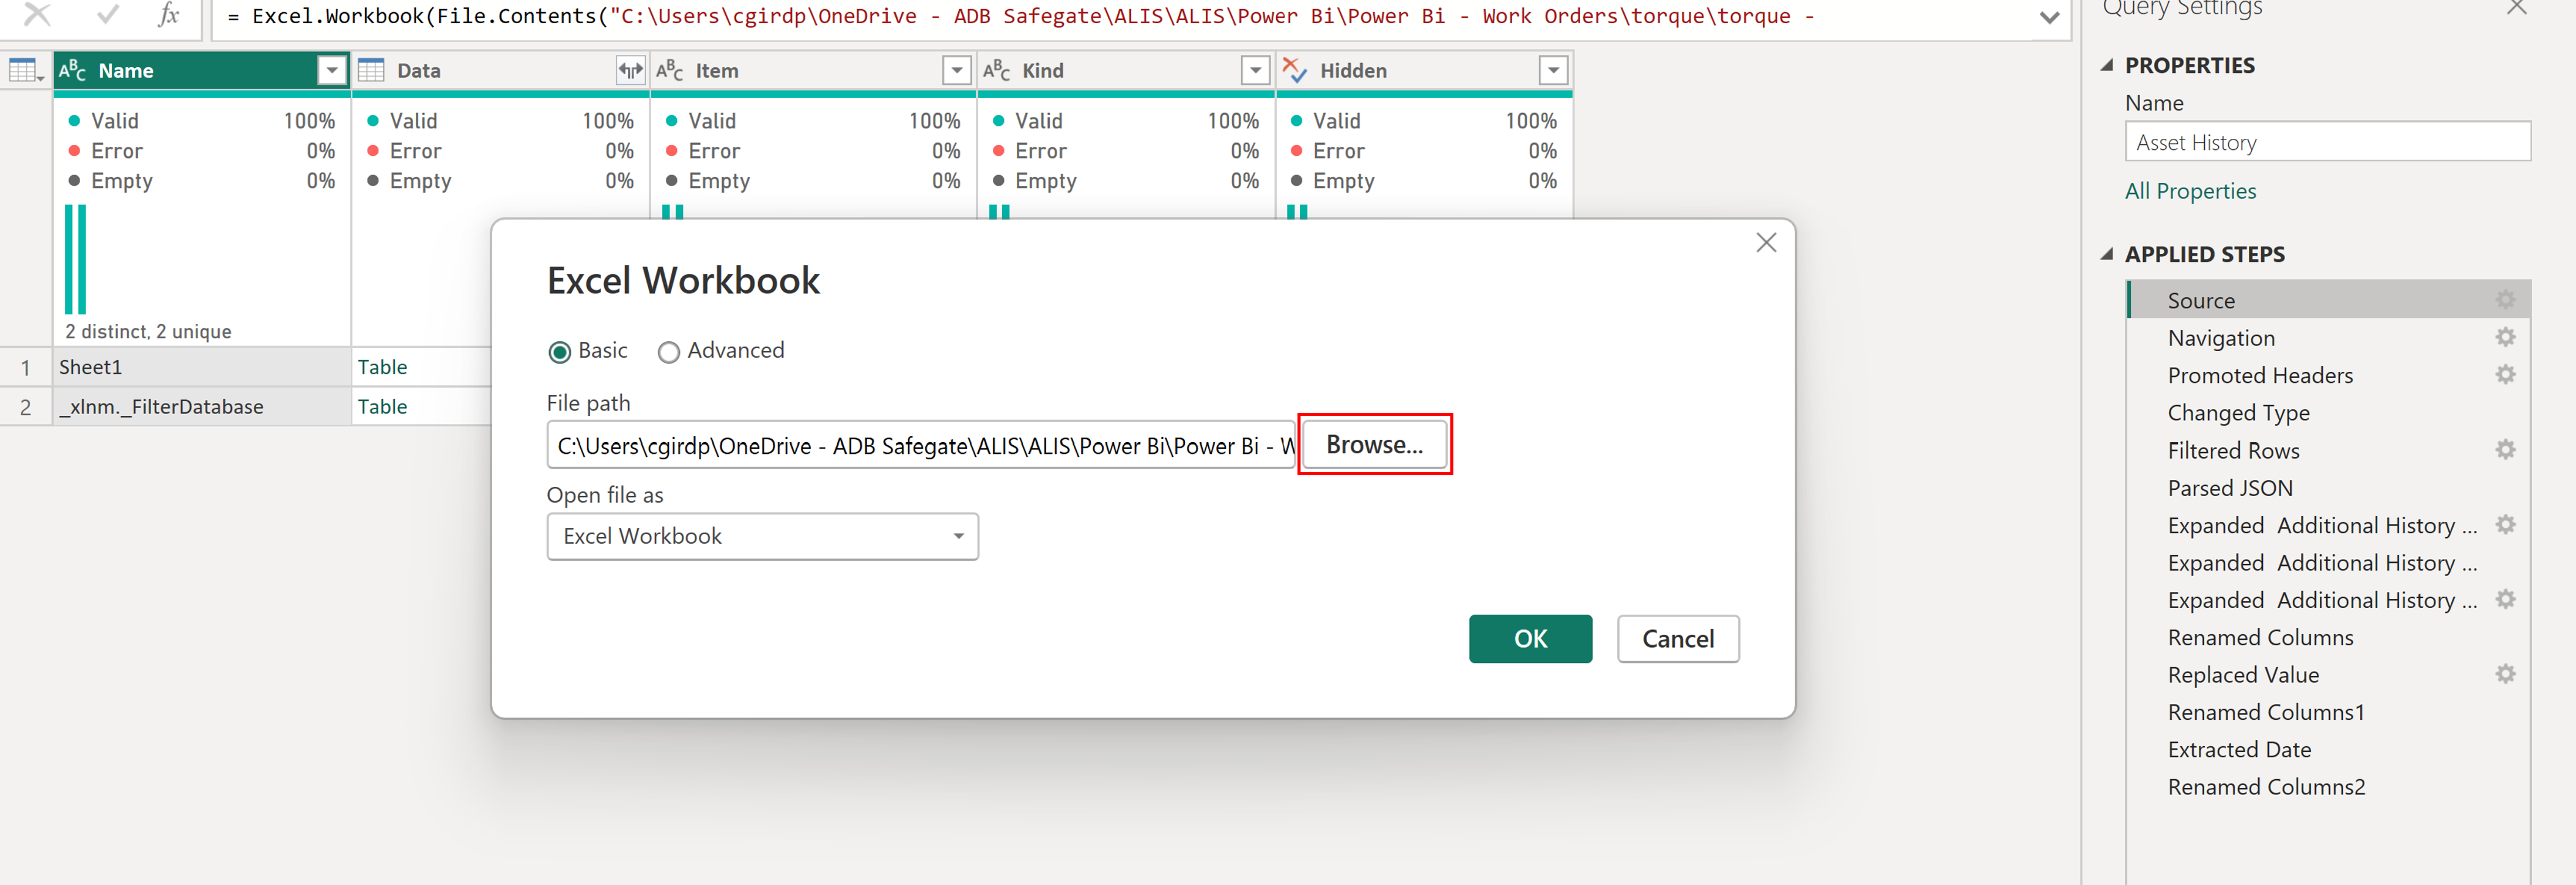
Find the Asset history excel file and click Open (if you don’t have this see What do you need no.3 asset history)
Once you have chosen the file, click OK
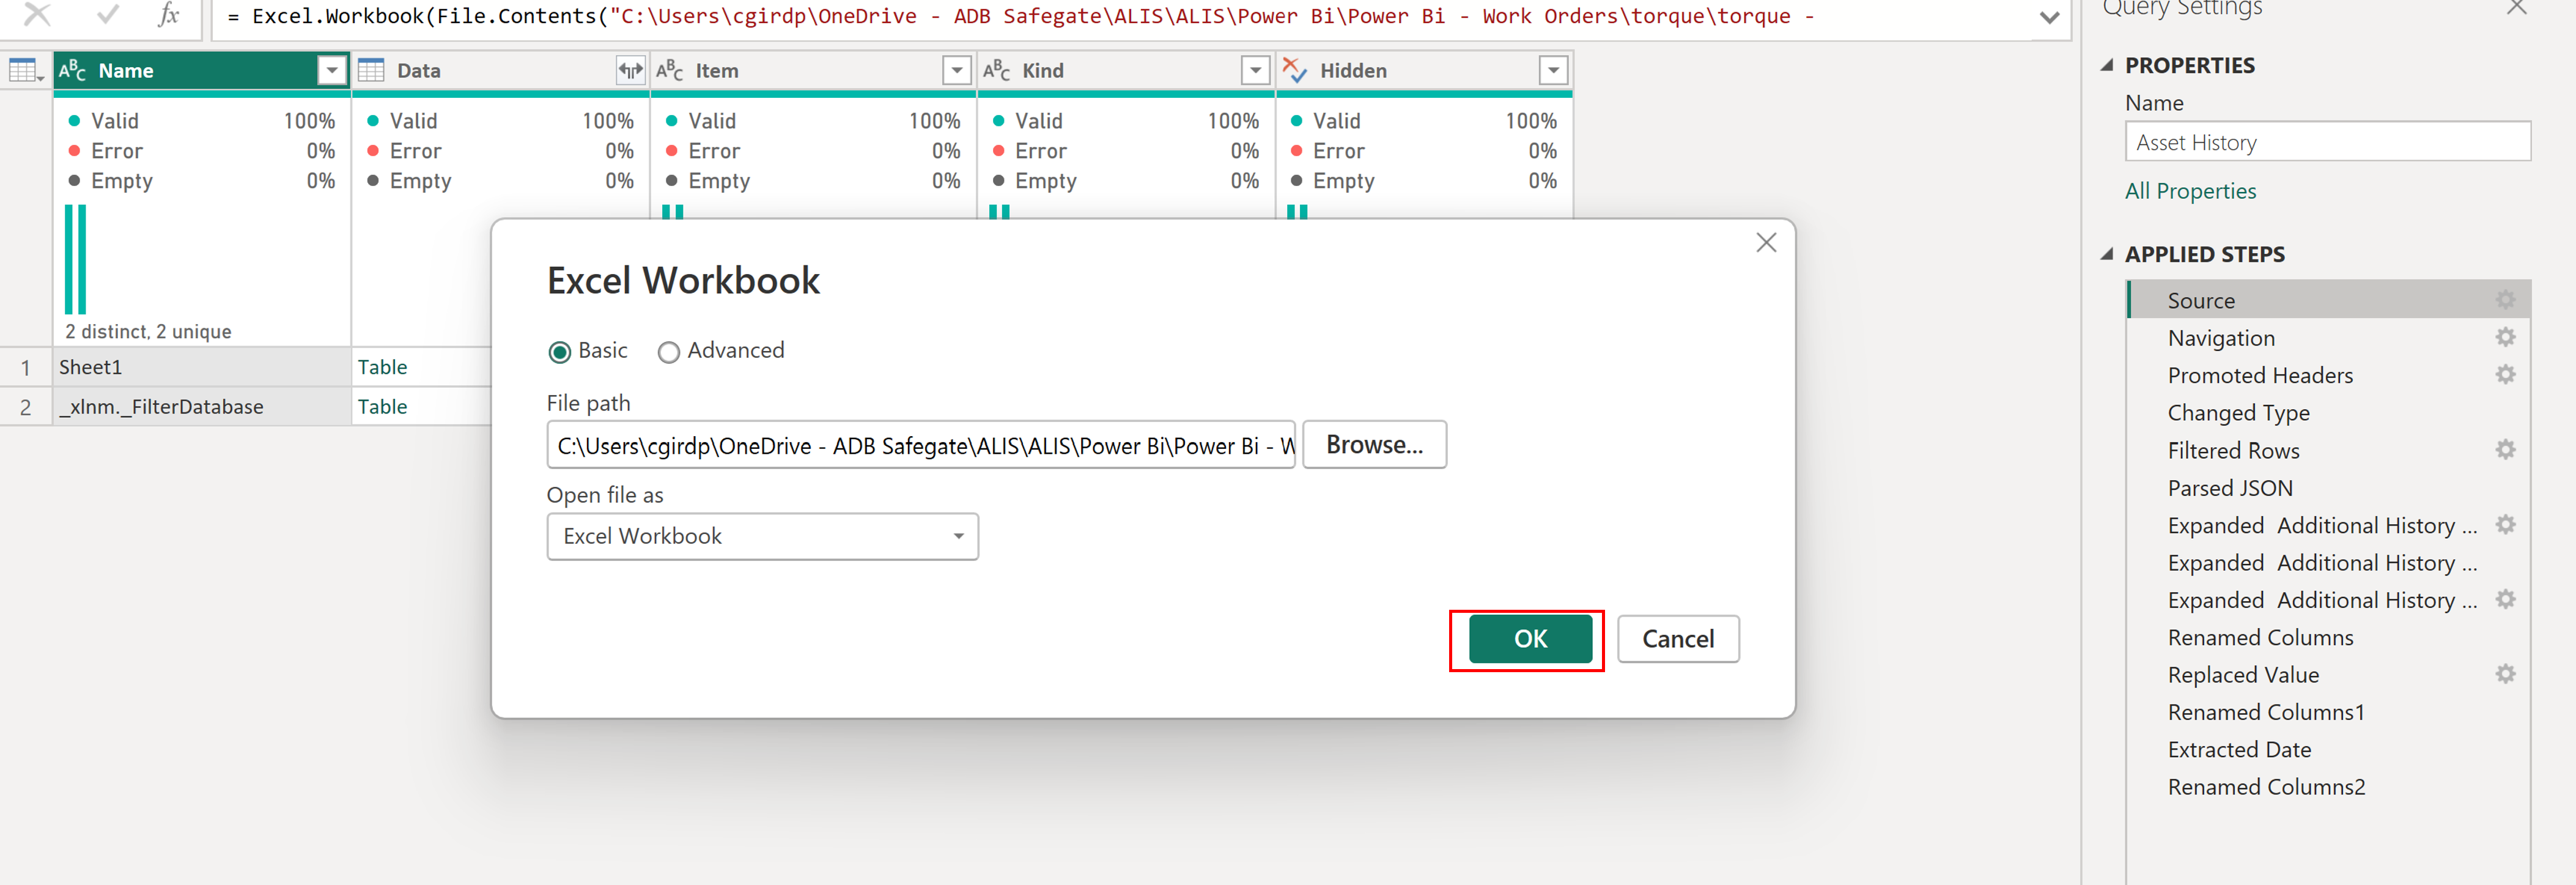
If you find errors, see Common Errors
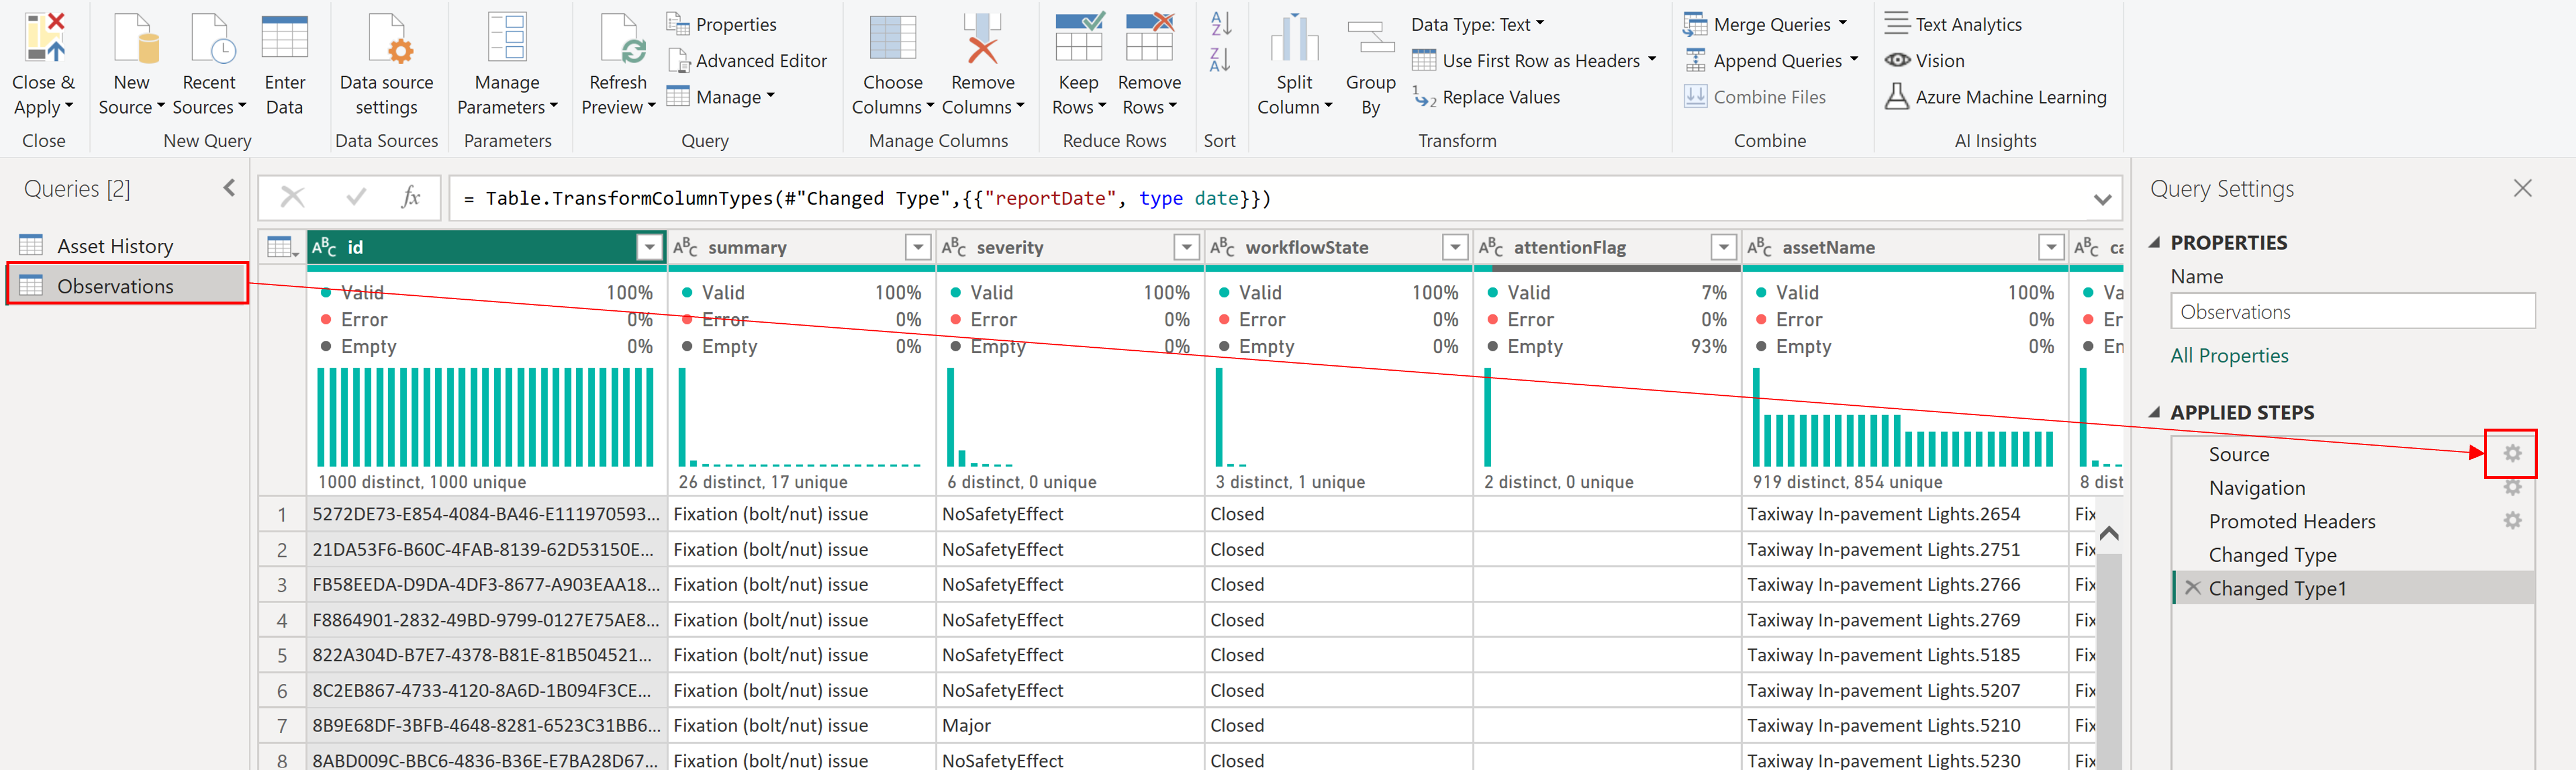
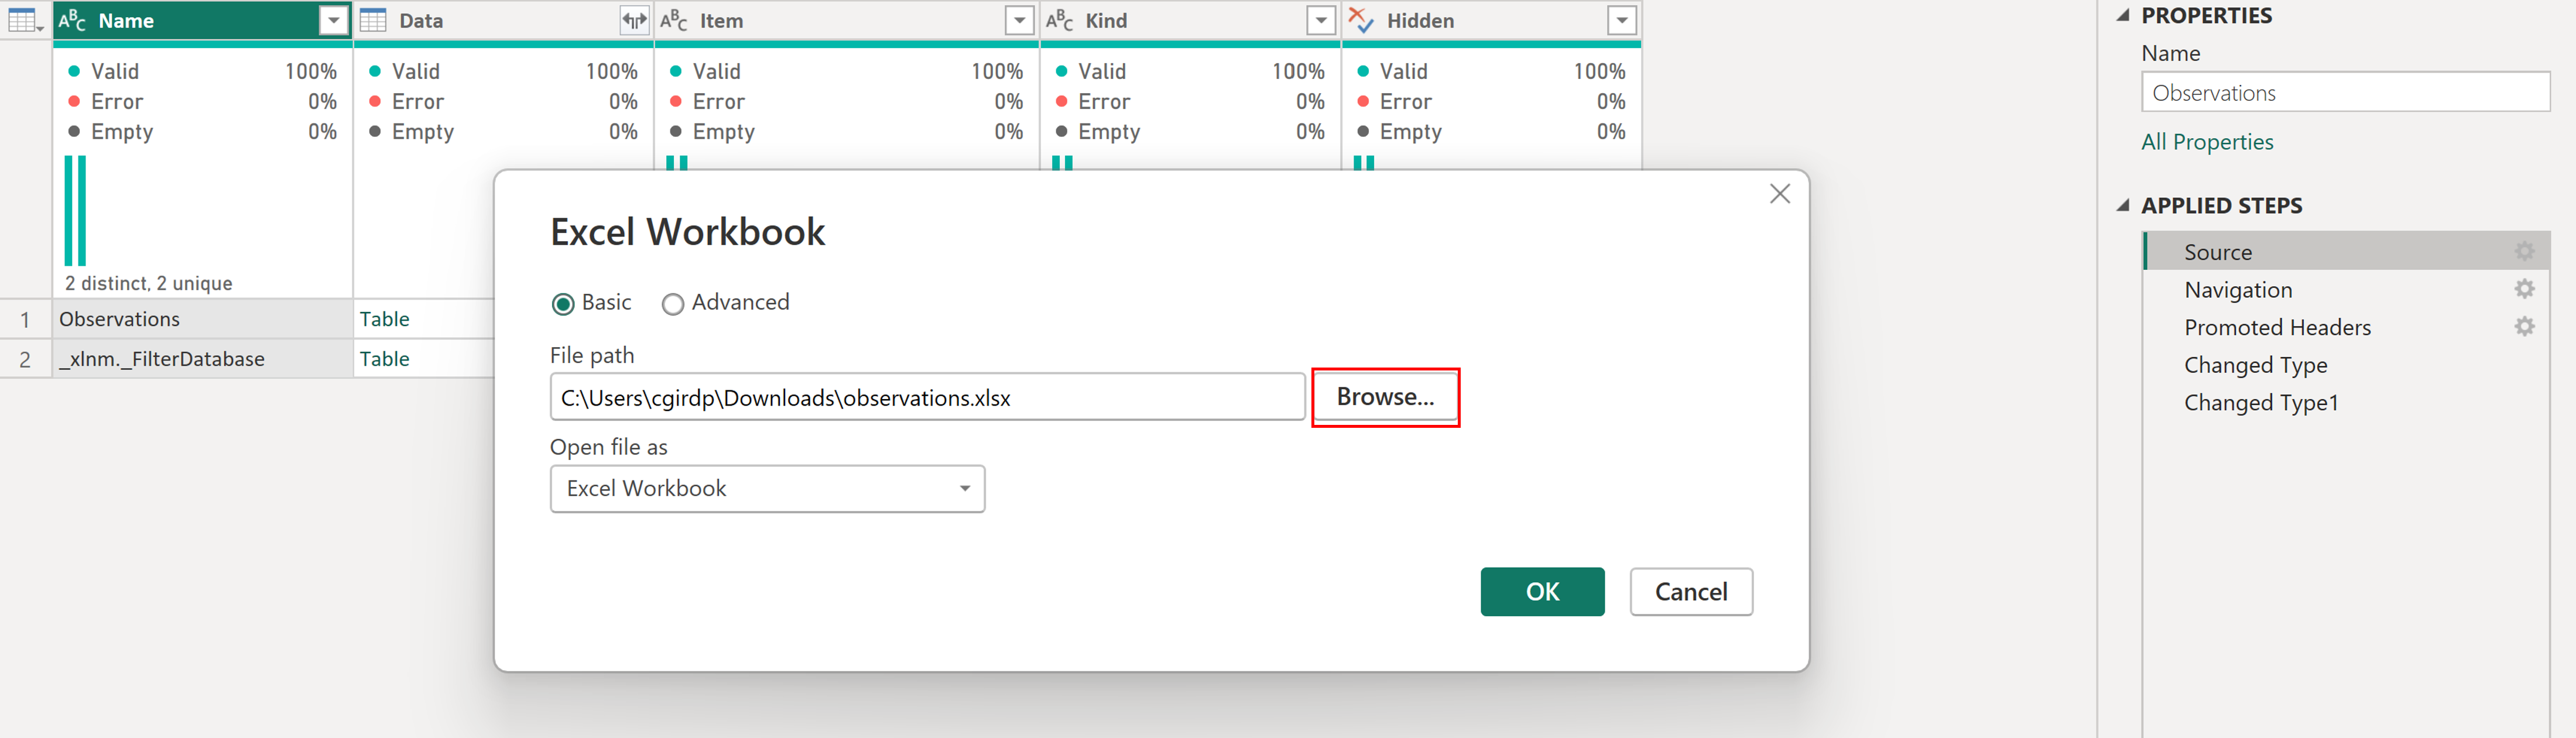
Import the observation excel file. Select Observations and click the small gear next to the Source.
Click Browse
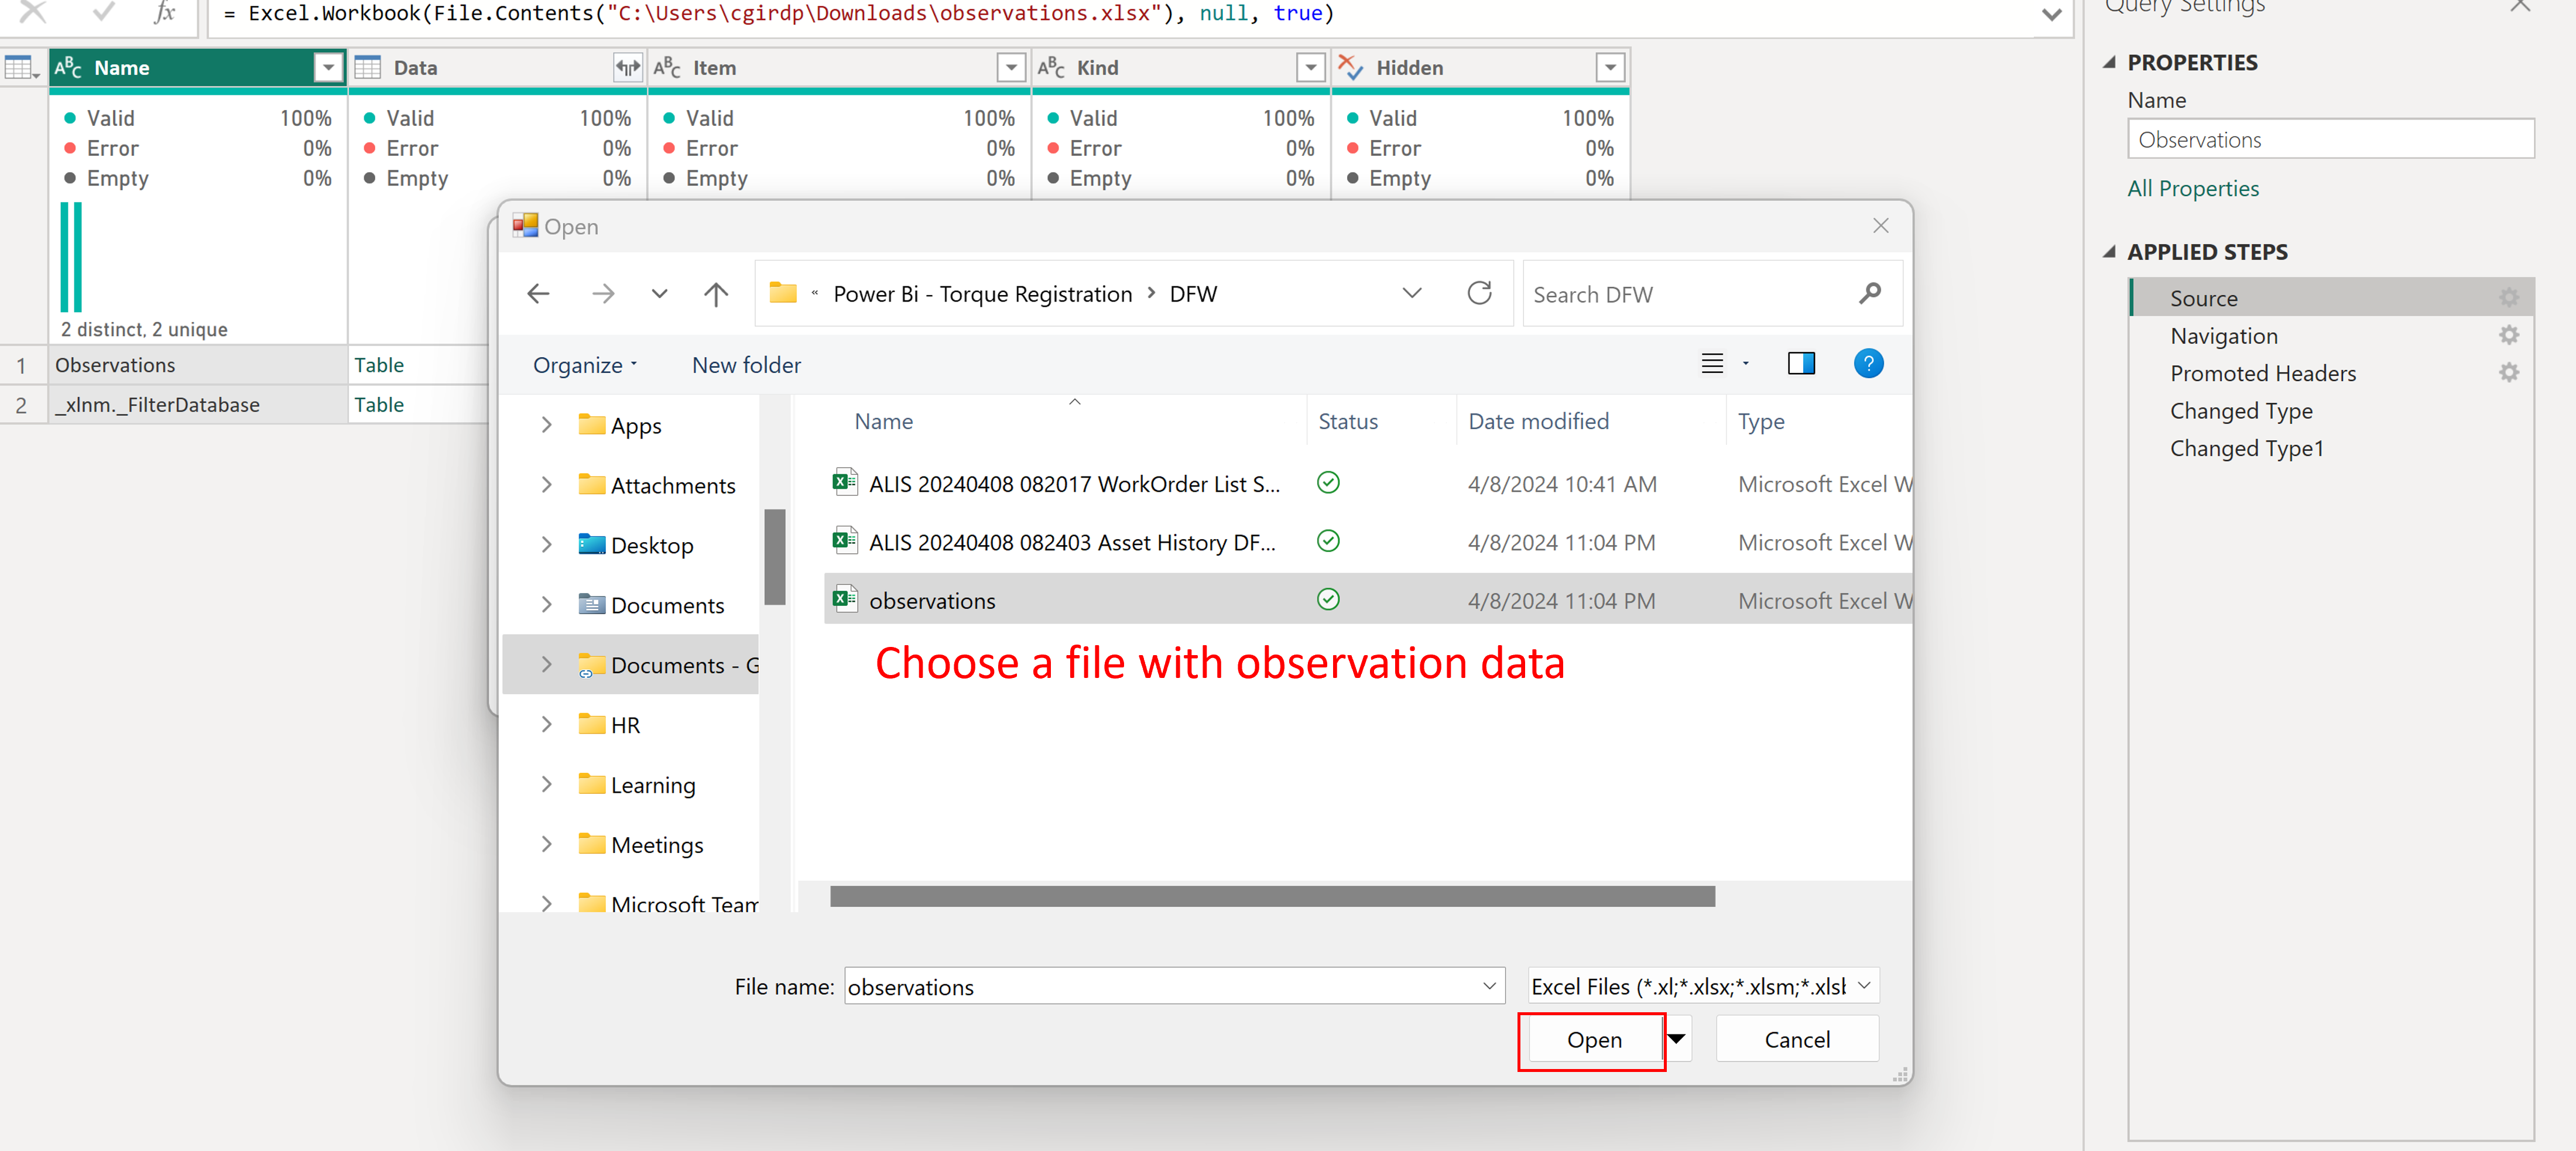
Choose a file with observation data. It’s important that your data includes both open and closed observations. (If you don’t have the file, see What do you need no.4 observation)
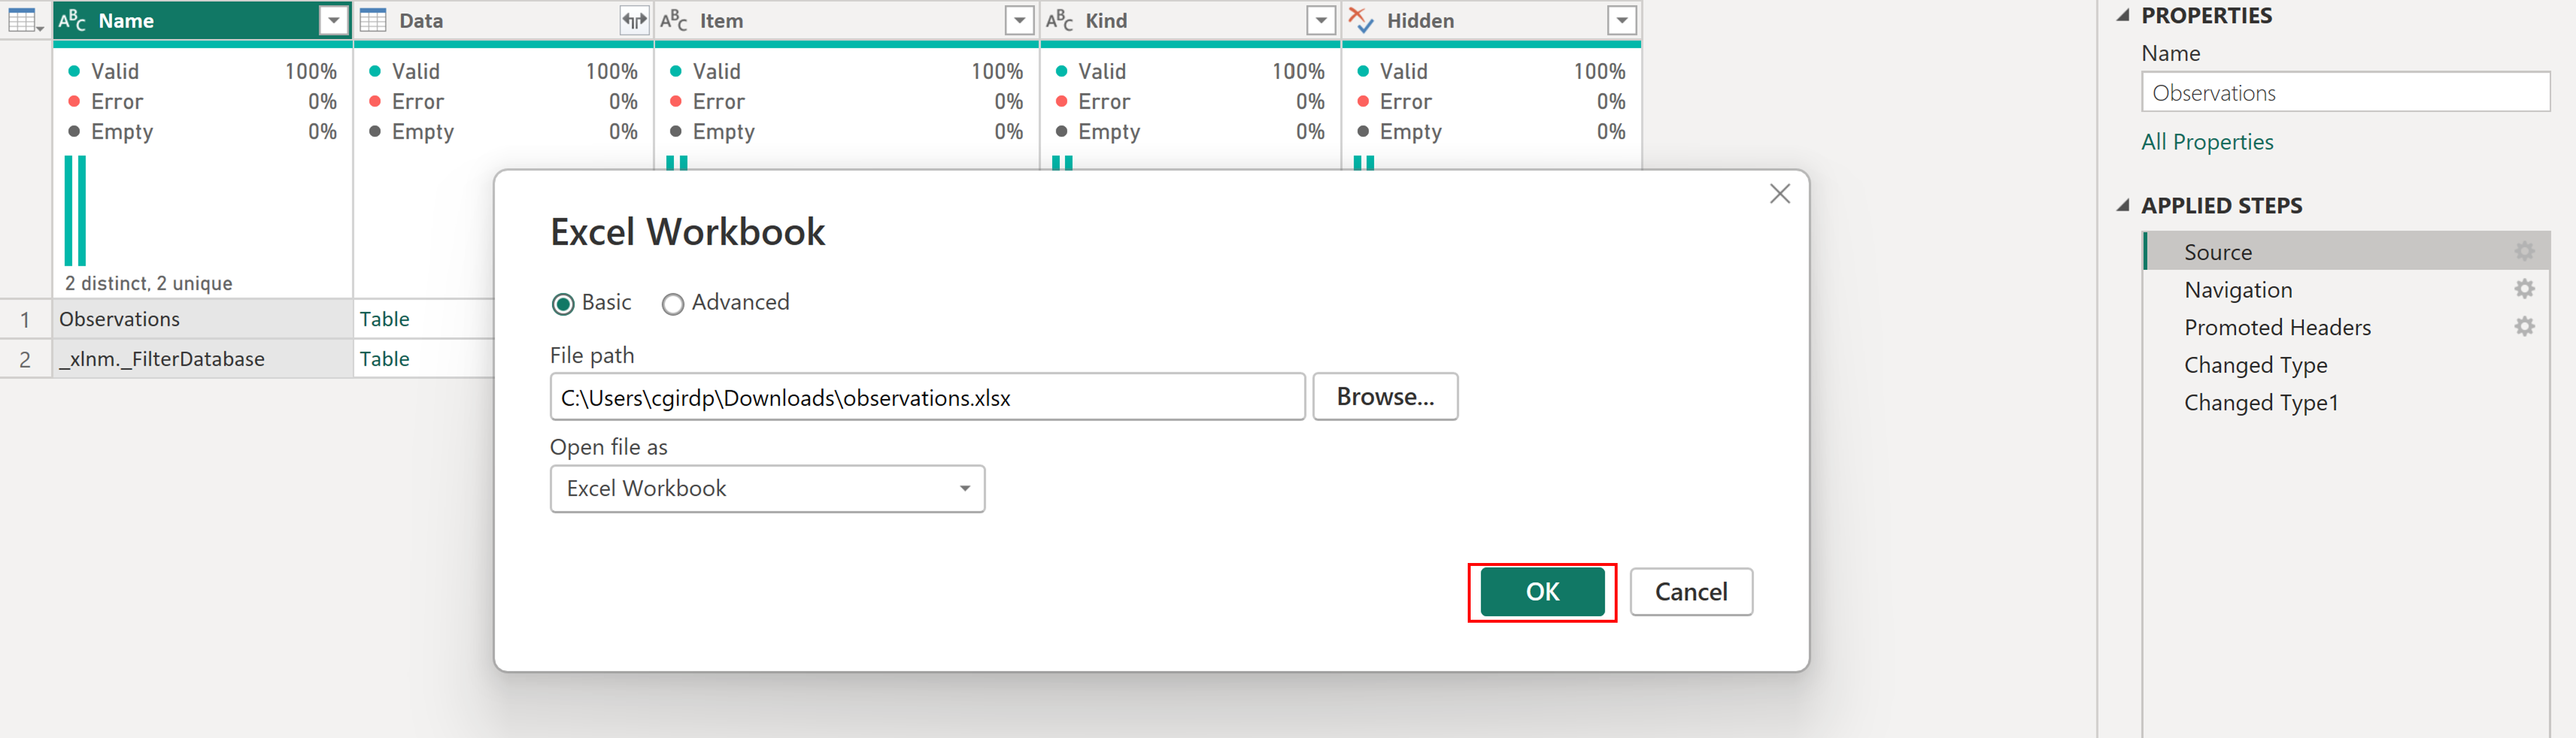
Once you have chosen the correct file, click OK.
Close & Apply
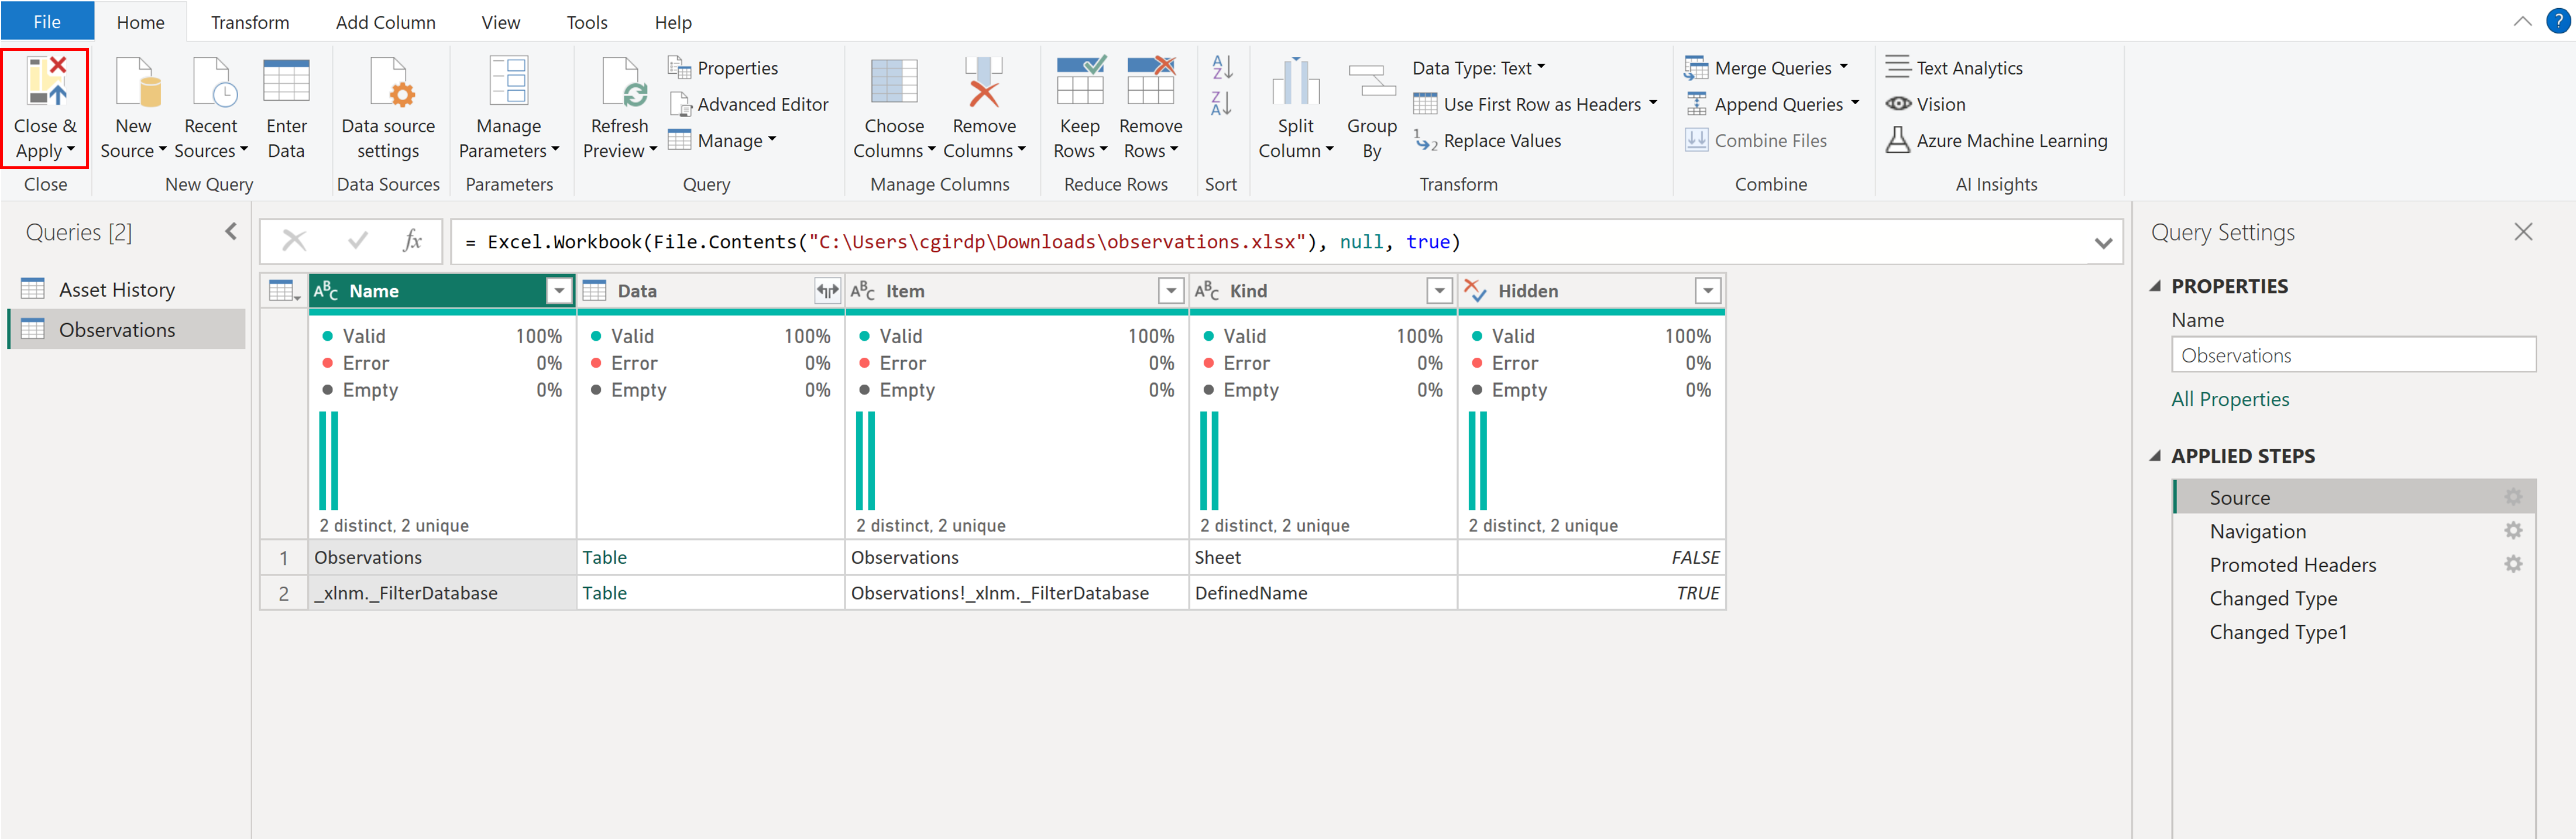
The new datas should be shown in the visualization. Click publish to publish the report to the cloud.
If you find errors, see Common Errors.
Tips and Tricks
Instead of show the mean of the data, we recommend that you use the median. The reason is because mean can be affected outliers and the data will deviate too much. On the other hand, the median will not be skewed by exceptionally high or low data, therefore it is a better measure of data.
Reference: Median vs Mean
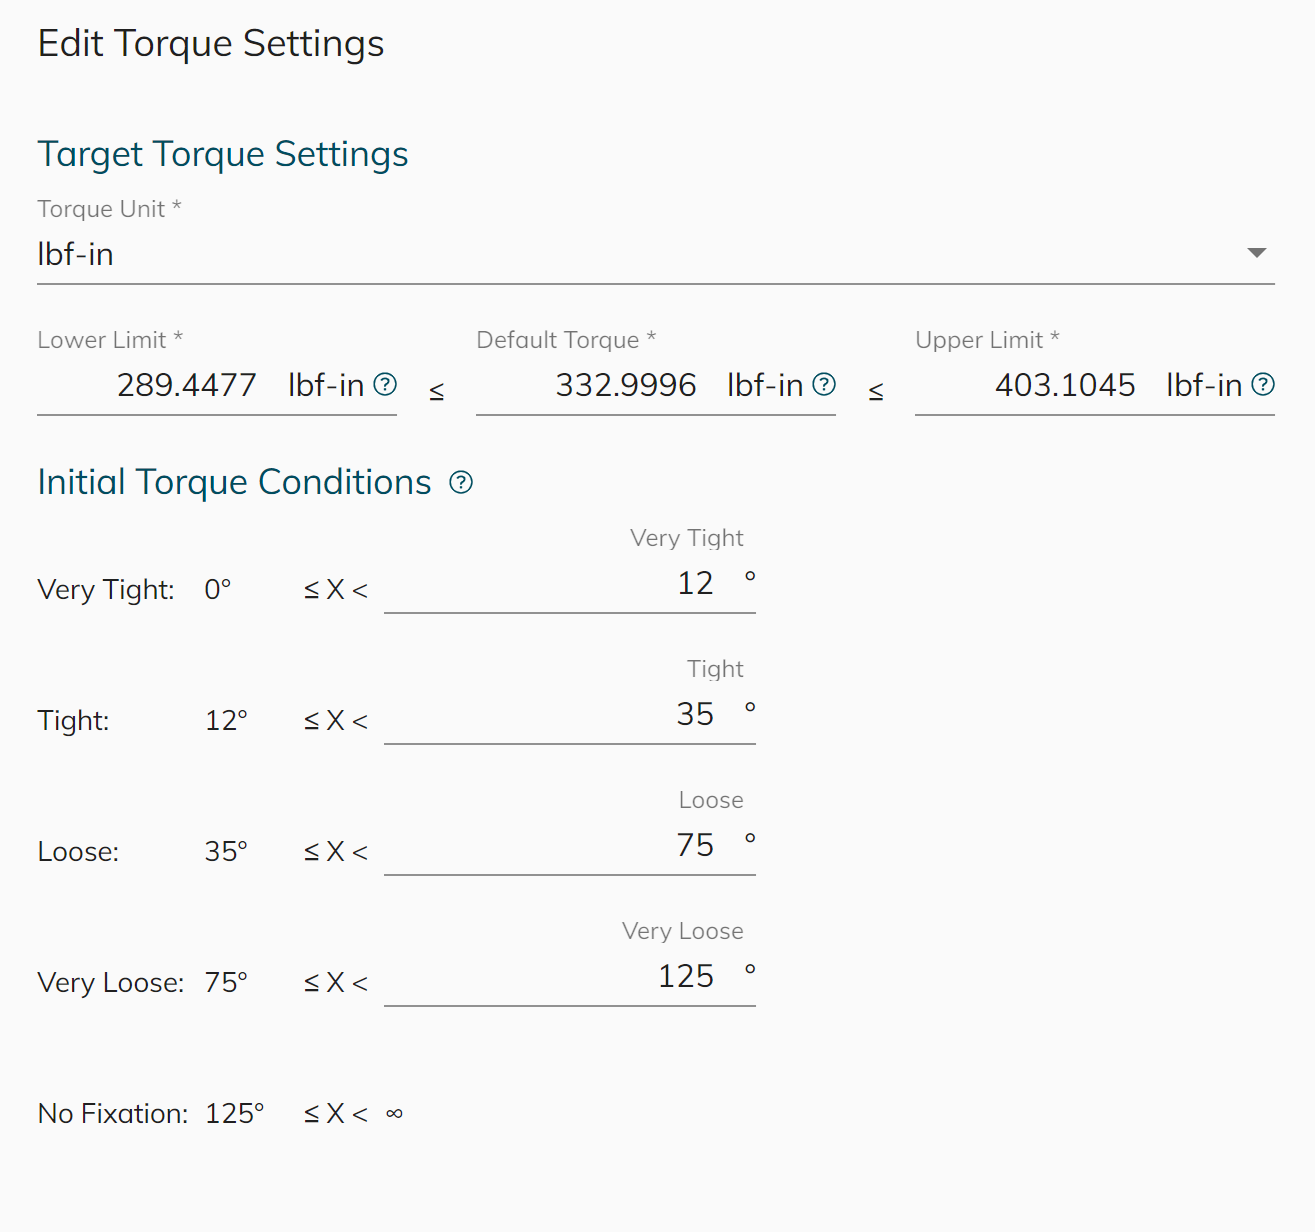
By default, the graph from the template is set to the following values:
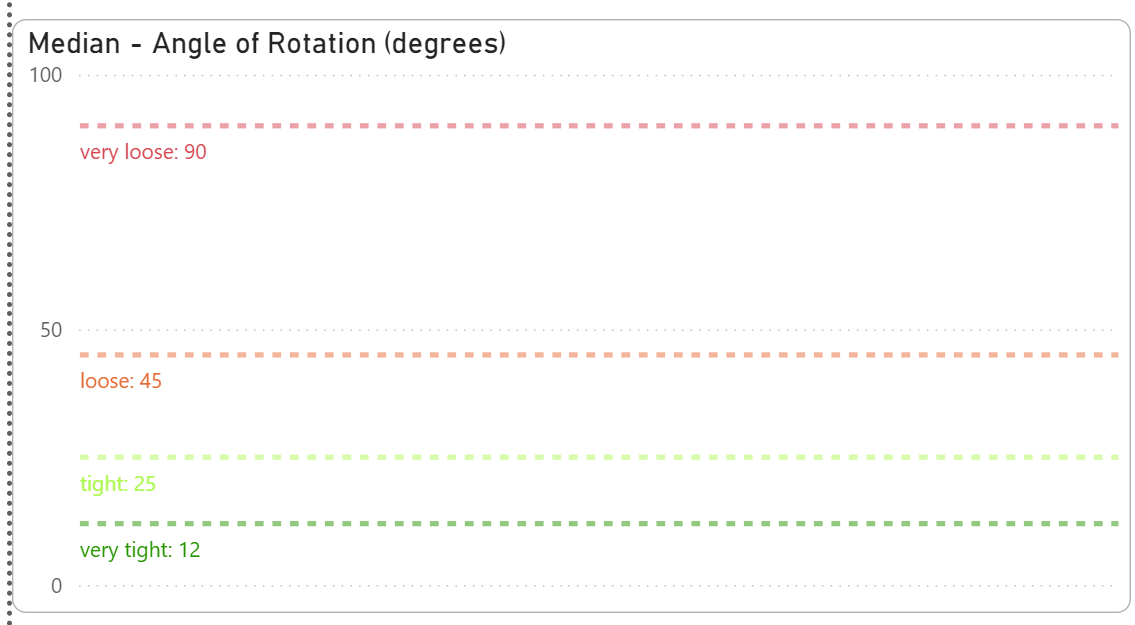
(default values for very loose, loose, tight, very tight, no fixation)
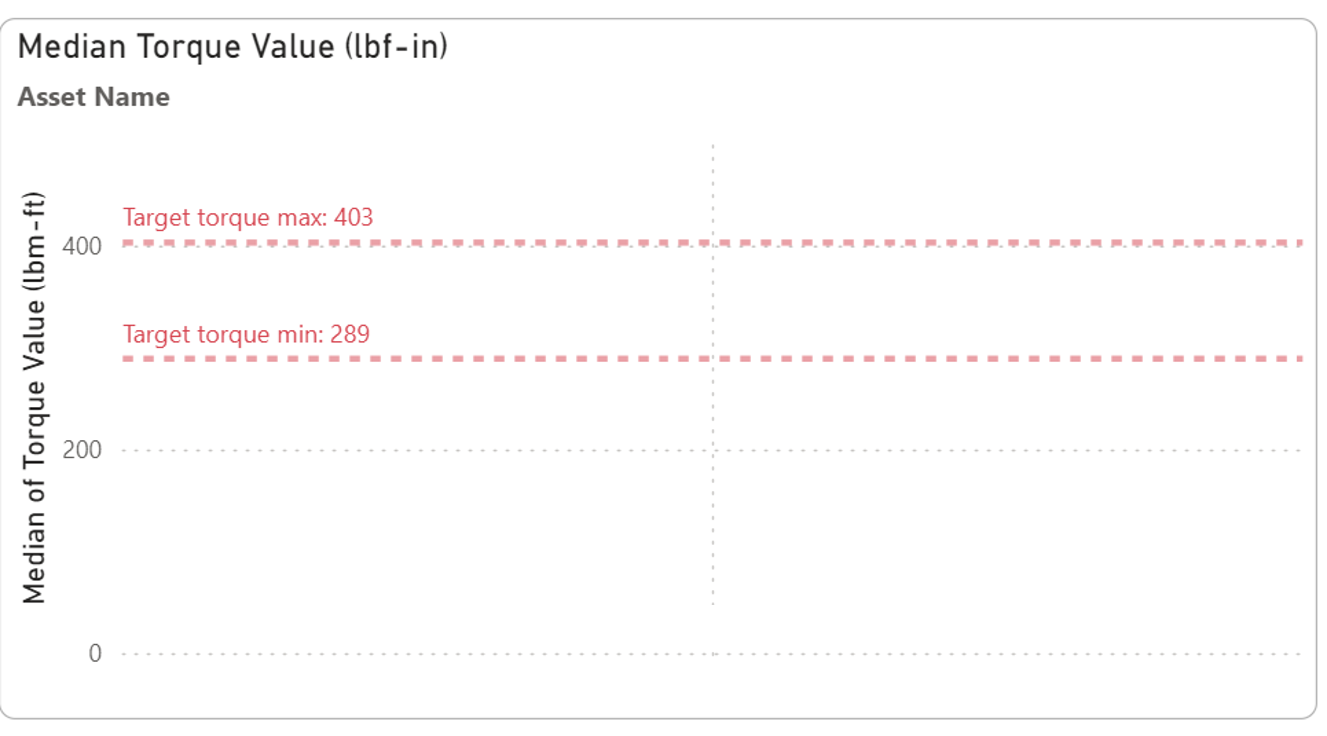
(default values for target torque max, target torque min)
(Disclaimer: these are just default values, it does not mean all airports have to use this value. Values depends on individual airport.)
To change the values in Power BI → go to Data → Asset history → find the ‘Insert…’ and change the values to match with your torque setting in CORTEX Service.
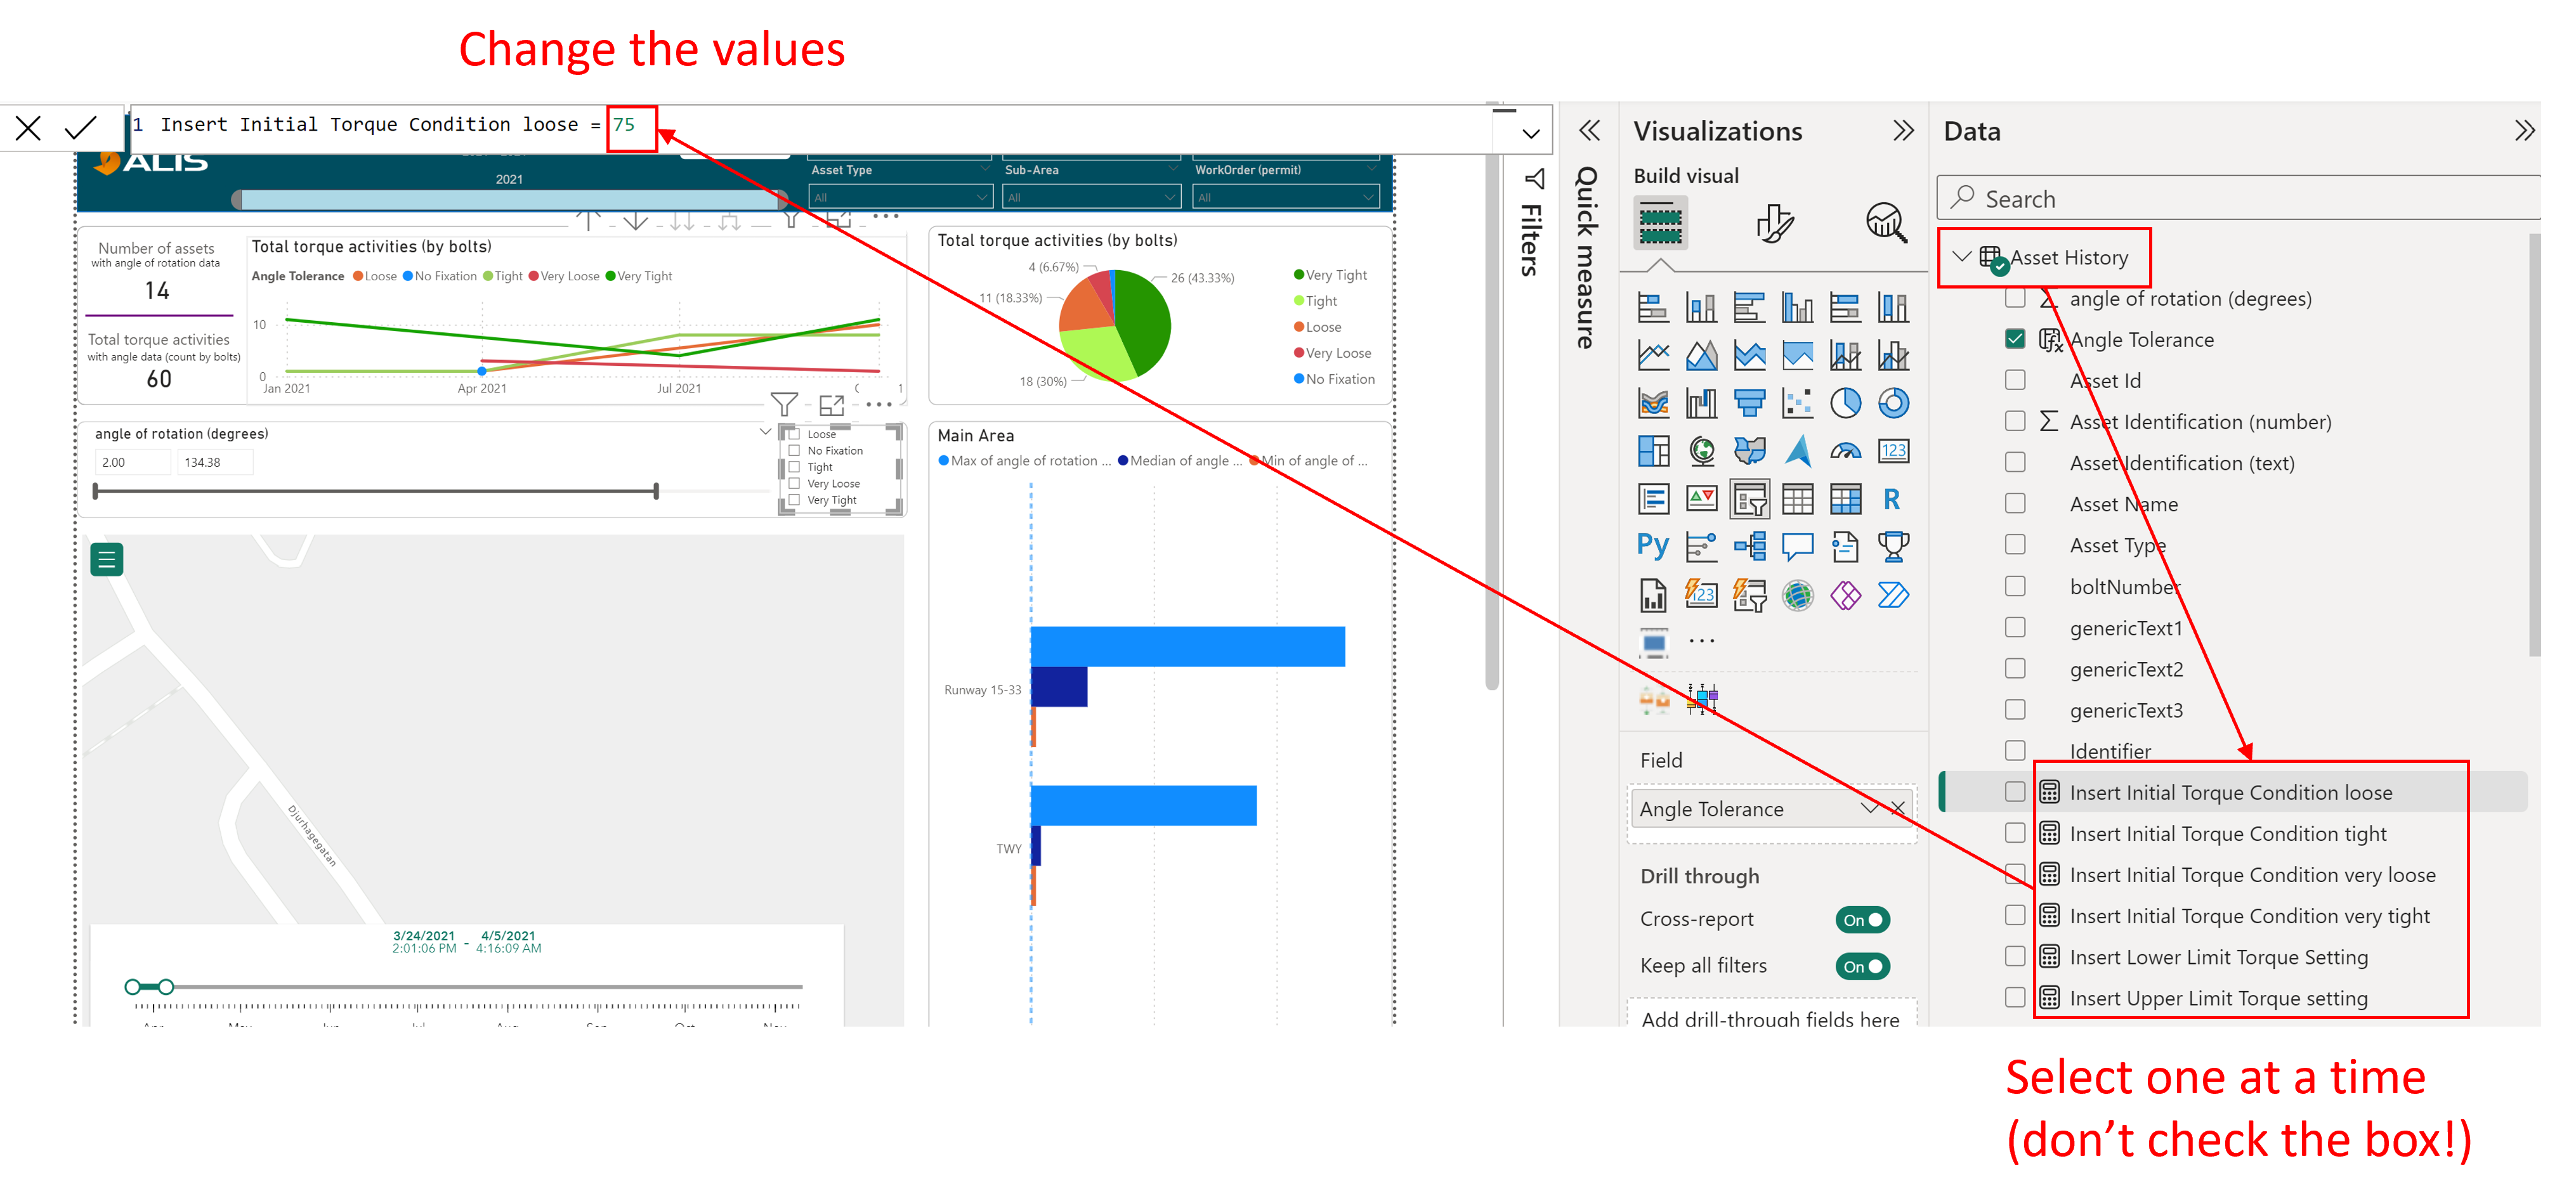
By changing these values in Power BI, you will allow the graphs to shift their values for better visuslization.
Example: change the min torque to 50 and max to 200. (Values in this example is not to be used as a reference).
You can find the values of your torque setting in CORTEX Service by: setting → Maintenance → Torque Settings
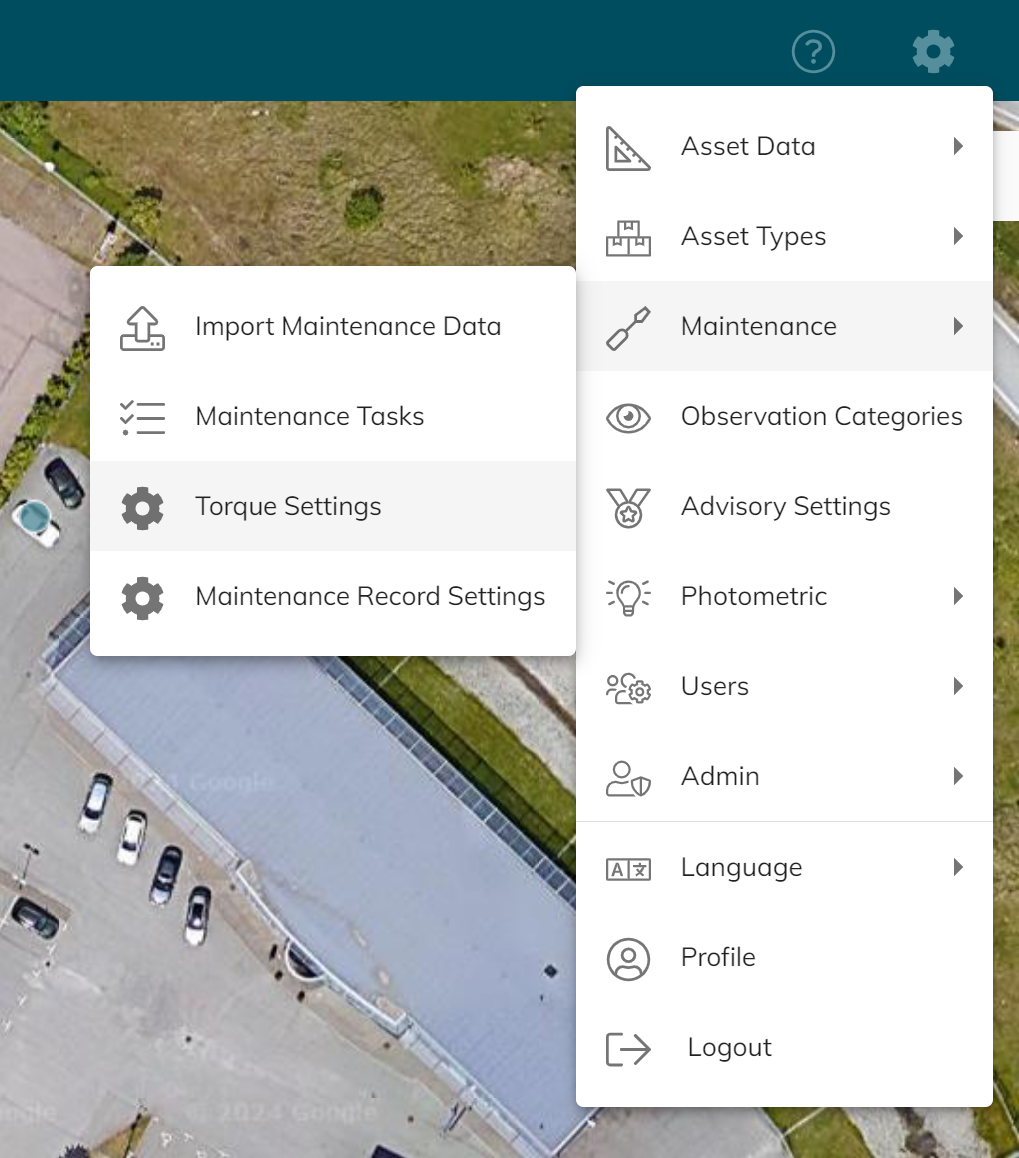
The power BI torque values should match with your CORTEX Service torque setting.
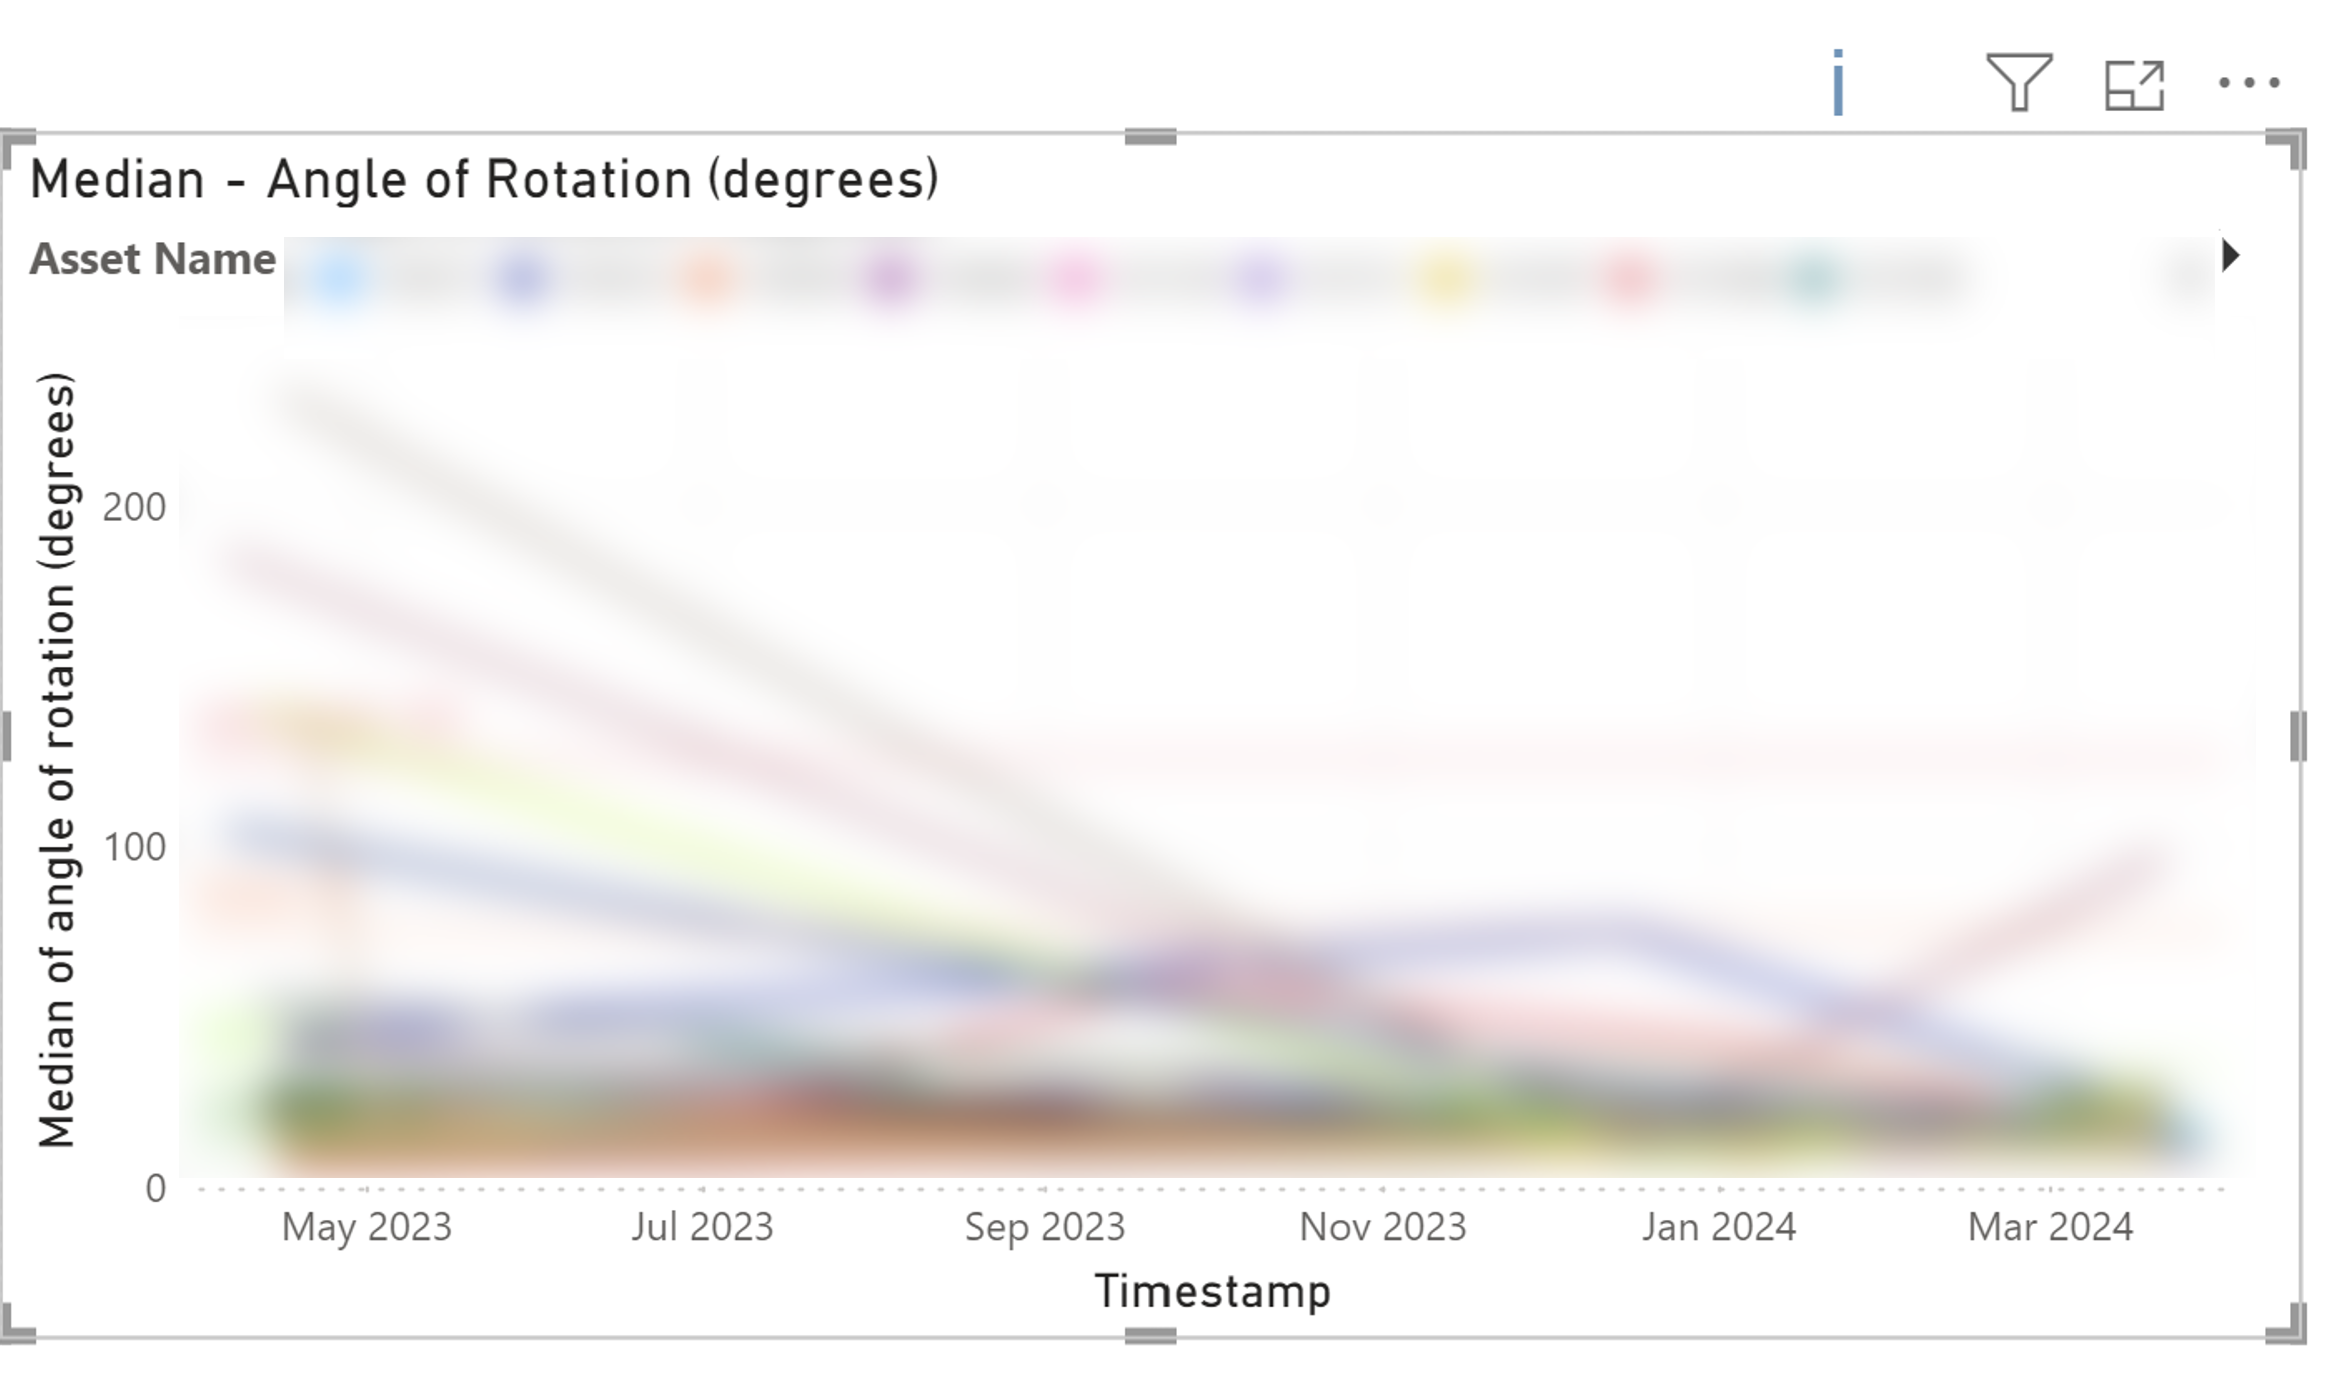
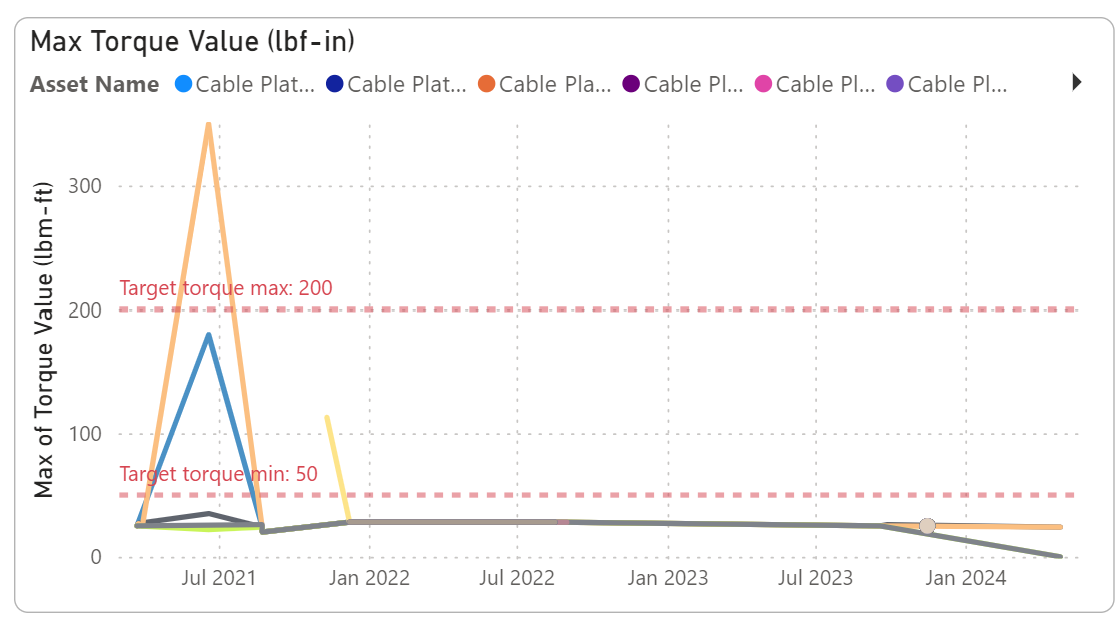
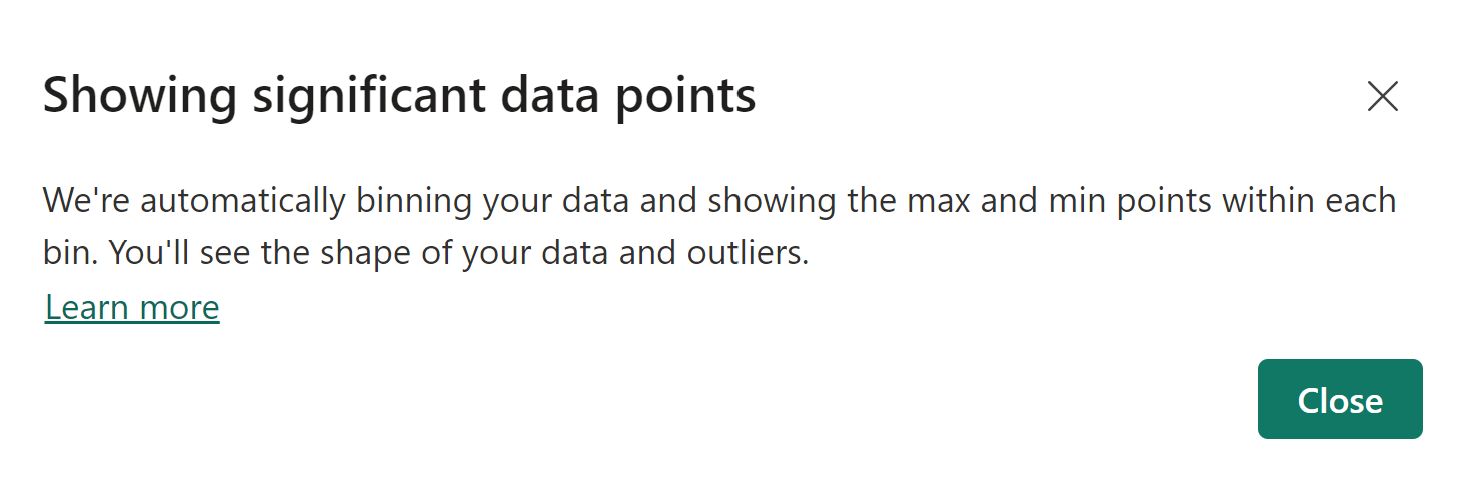
If there’s an ‘i’ when you hover above some graphs, please note that it means not all data are shown.
Example in this graph: This data contain more than 10k assets, so it’s not possible to show all 10k lines here. Power Bi will automatically bins down your data to show only the significant data points.
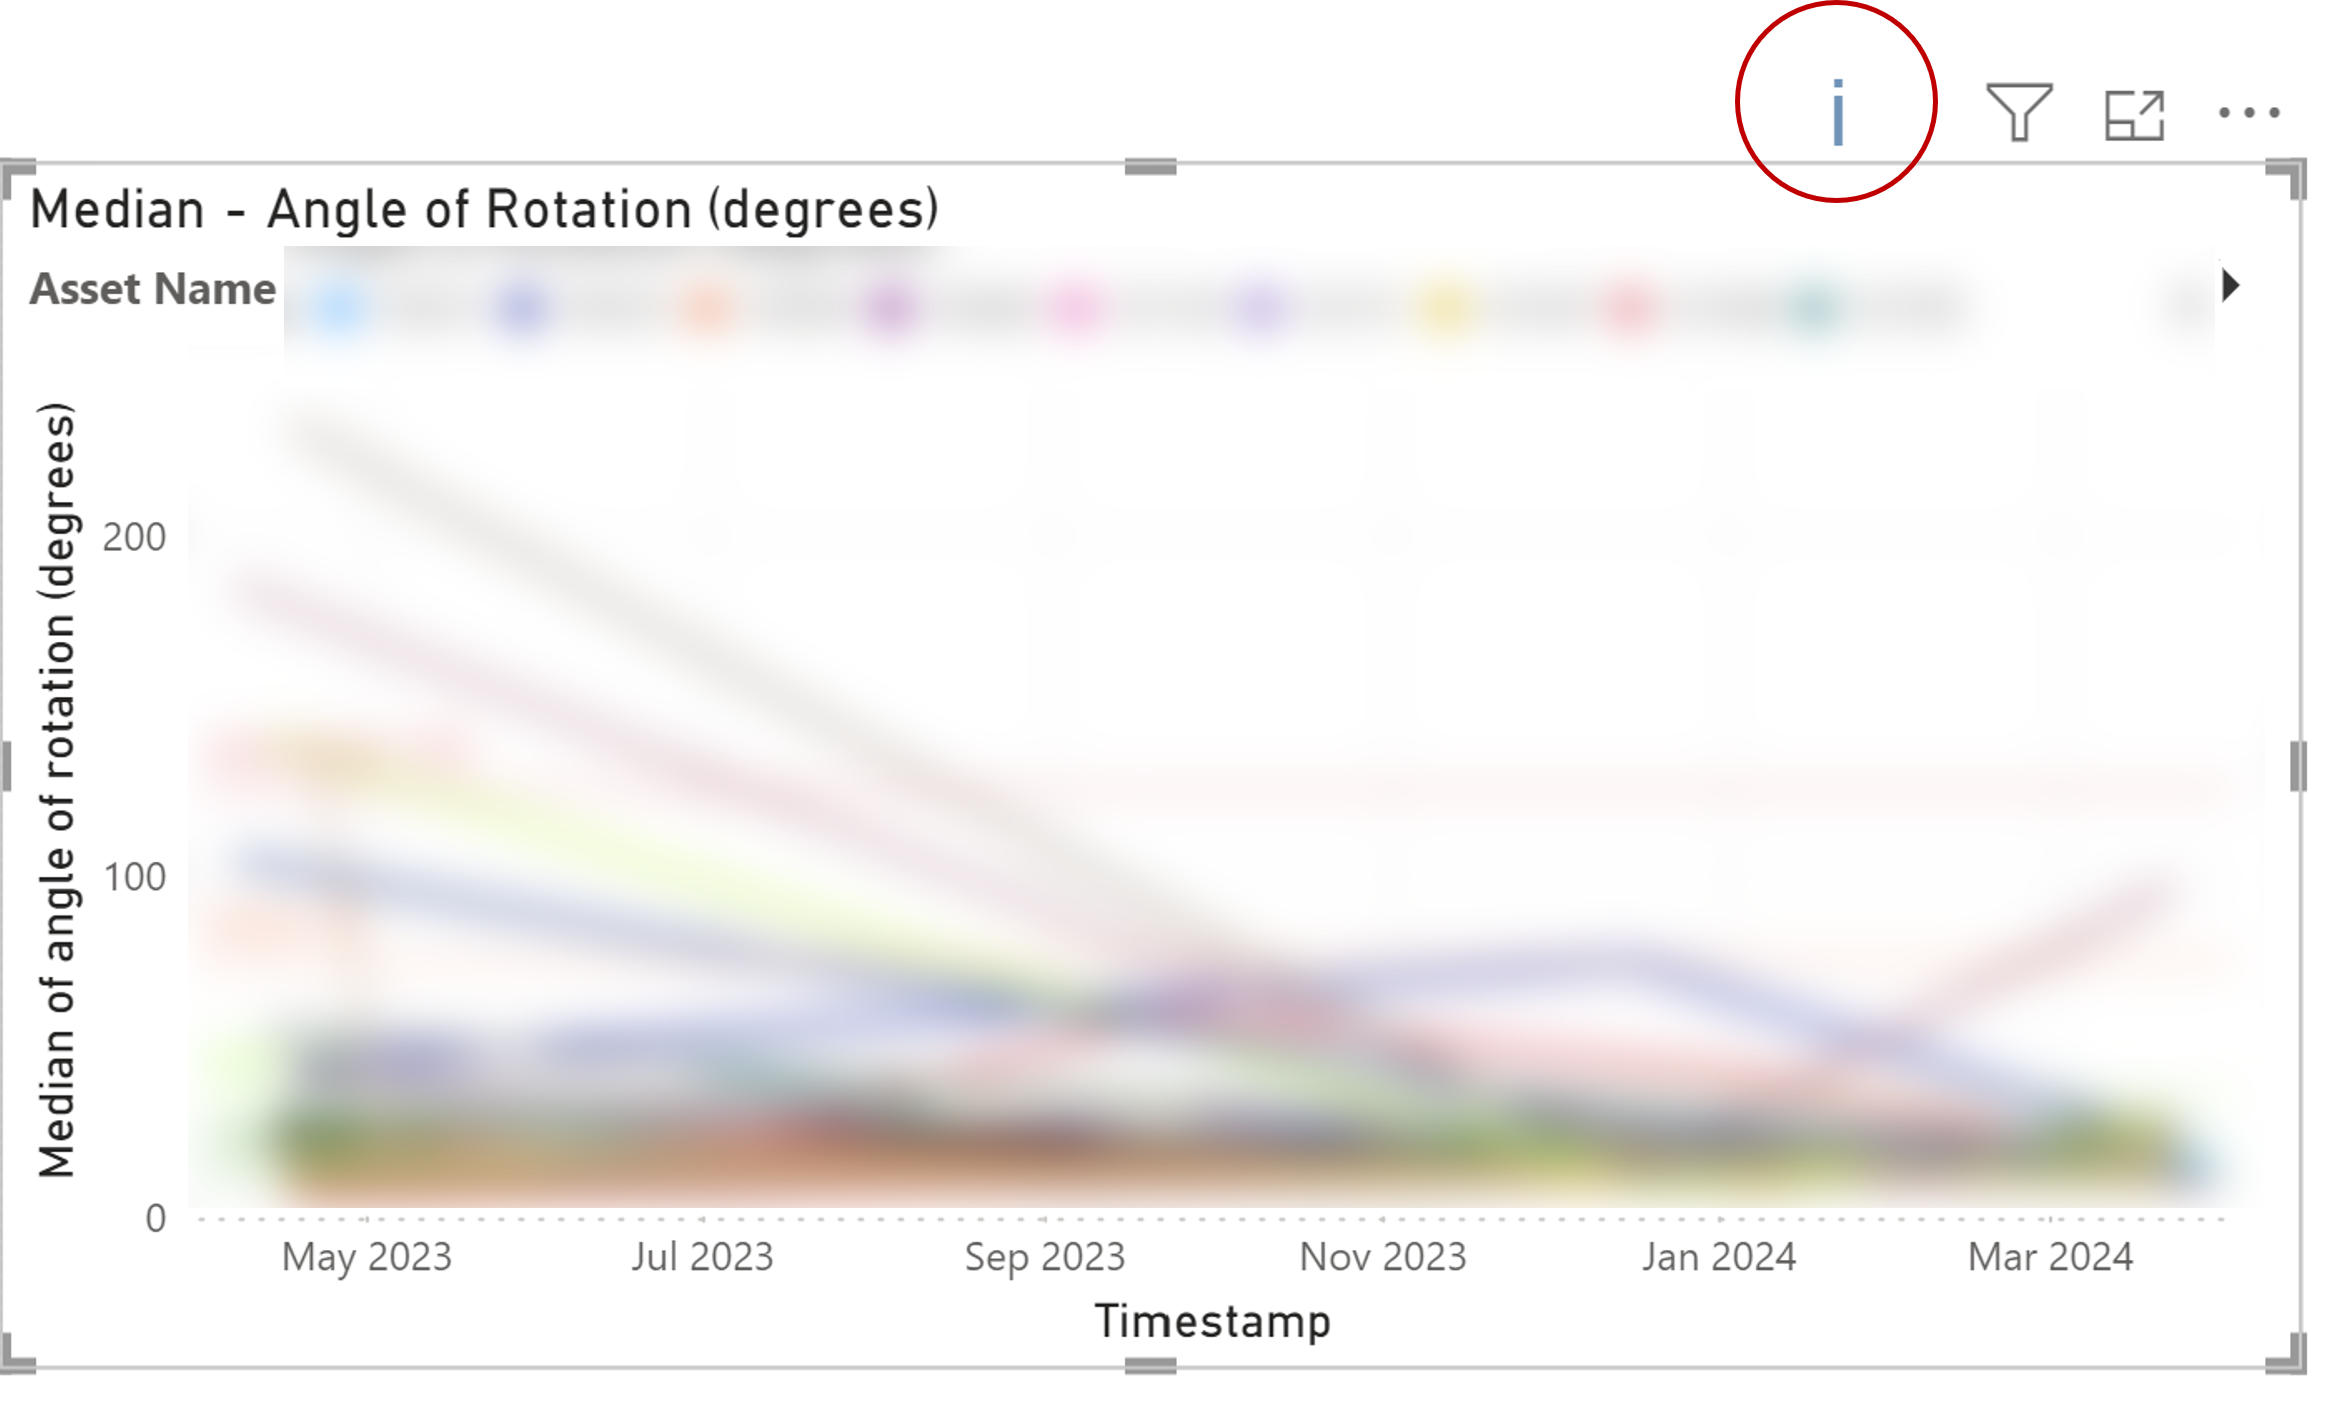
Recommendation: use filters to narrow down the data
Learn more about it here: High Density Line
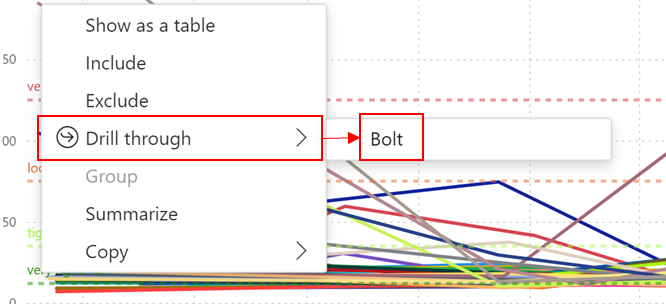
Some visualization allows you to drill through (aka.nagivate) to a hidden page. When you hover above that graph, you should see this:
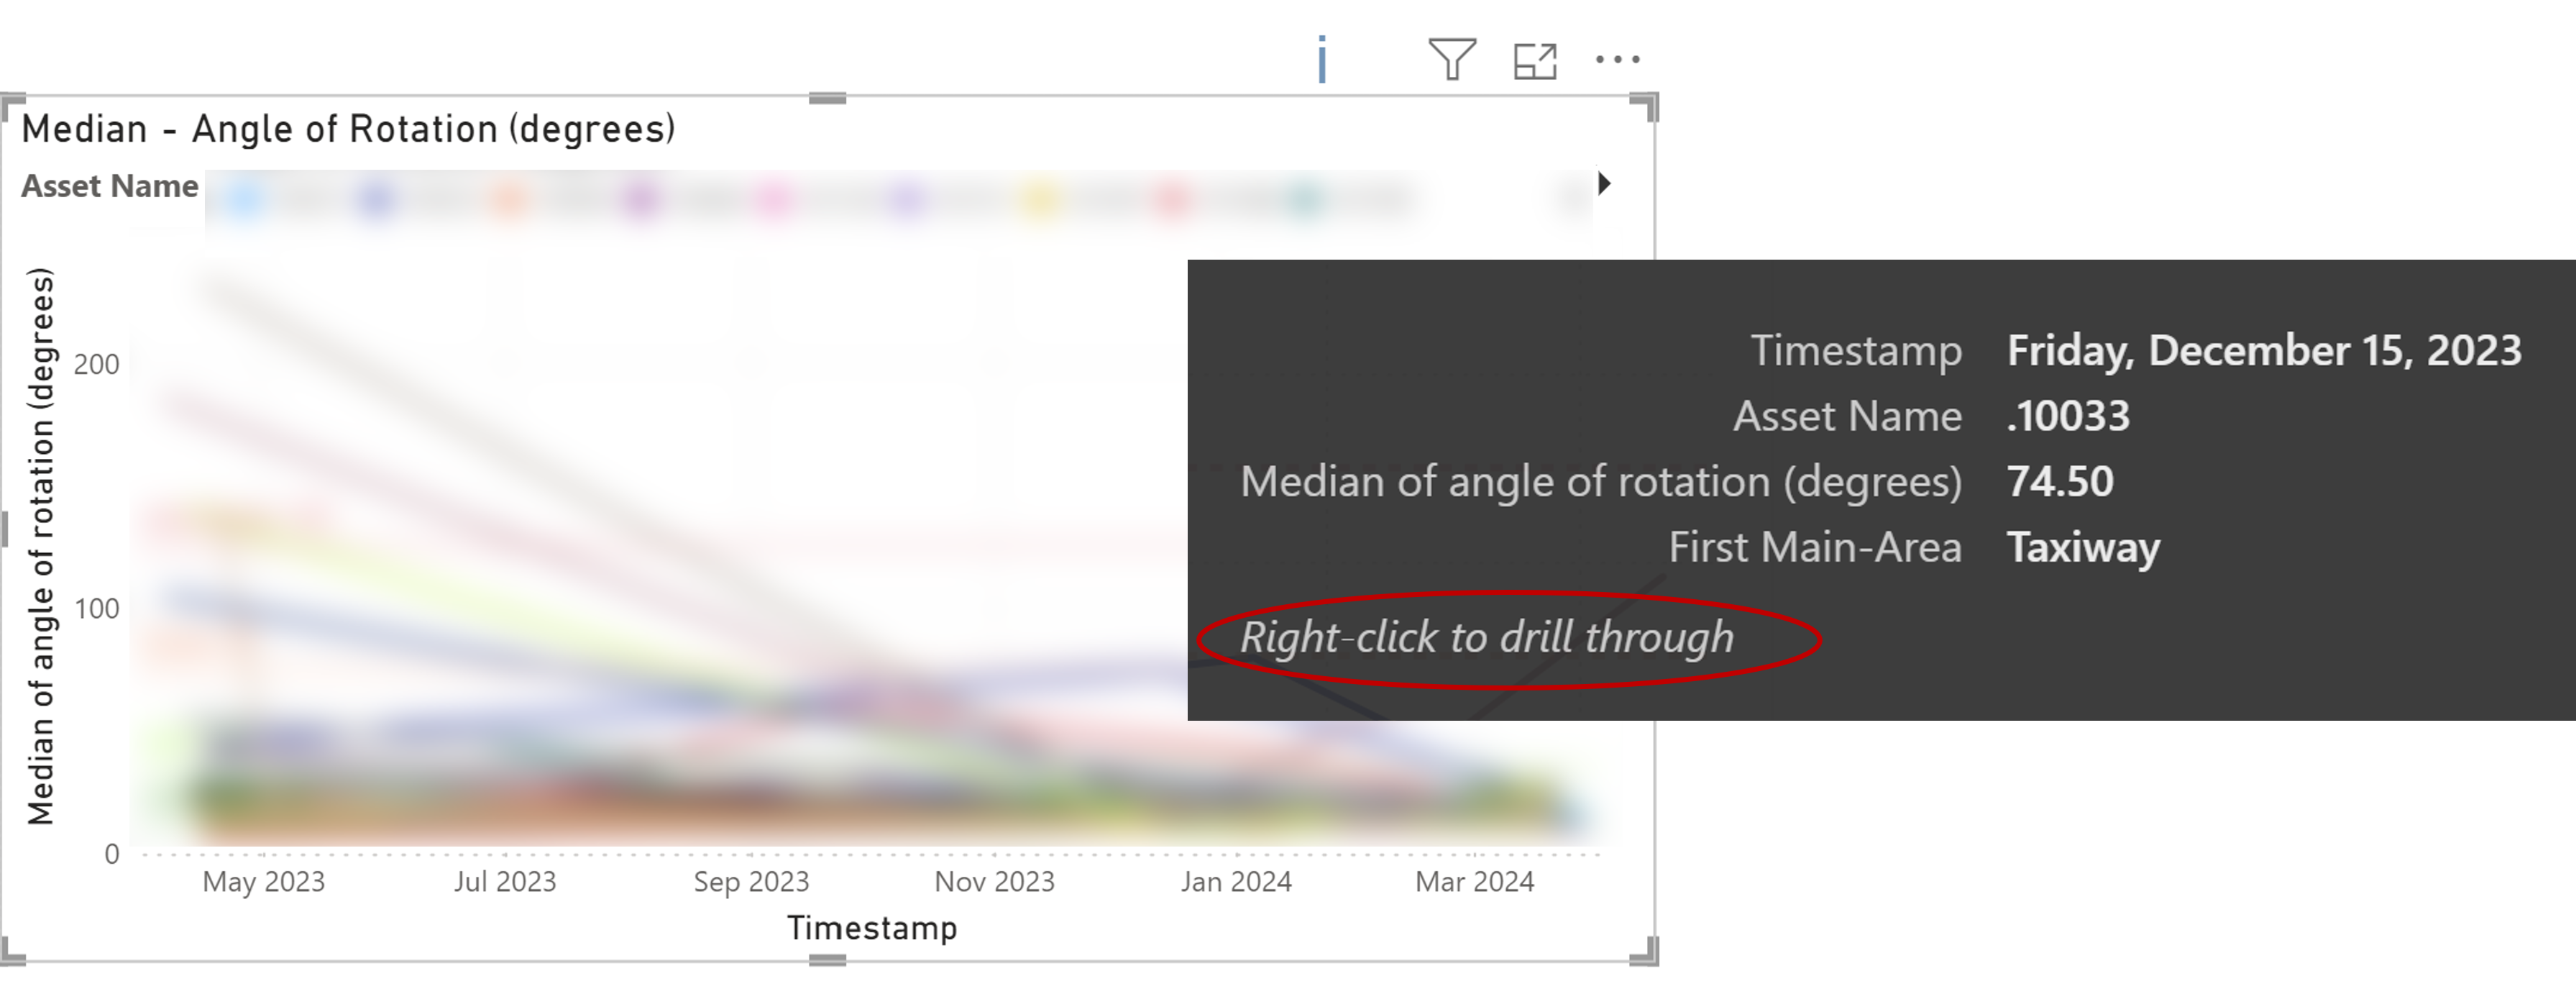
You can right click and choose to go to one of the hidden page.
Read more about drill-through here: Set up drill through
Common errors
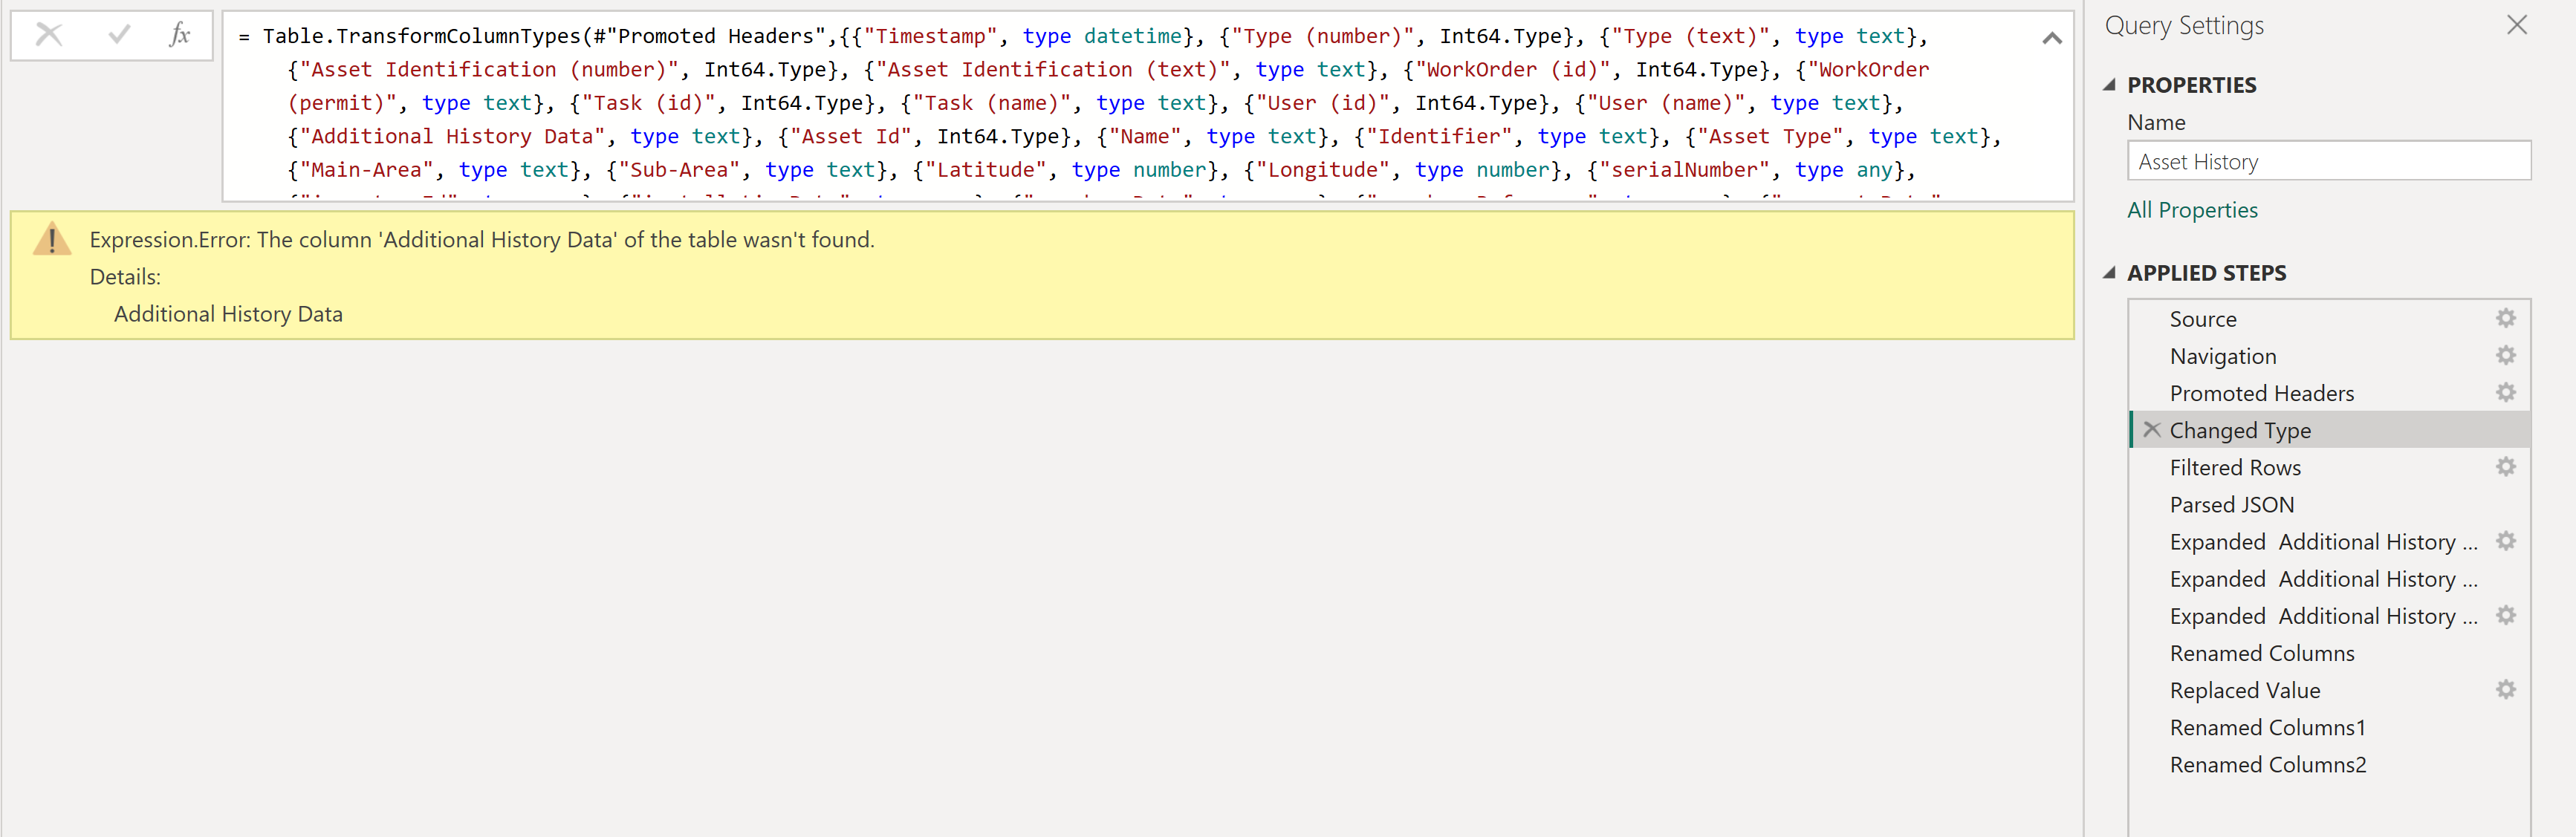
How to solve this?
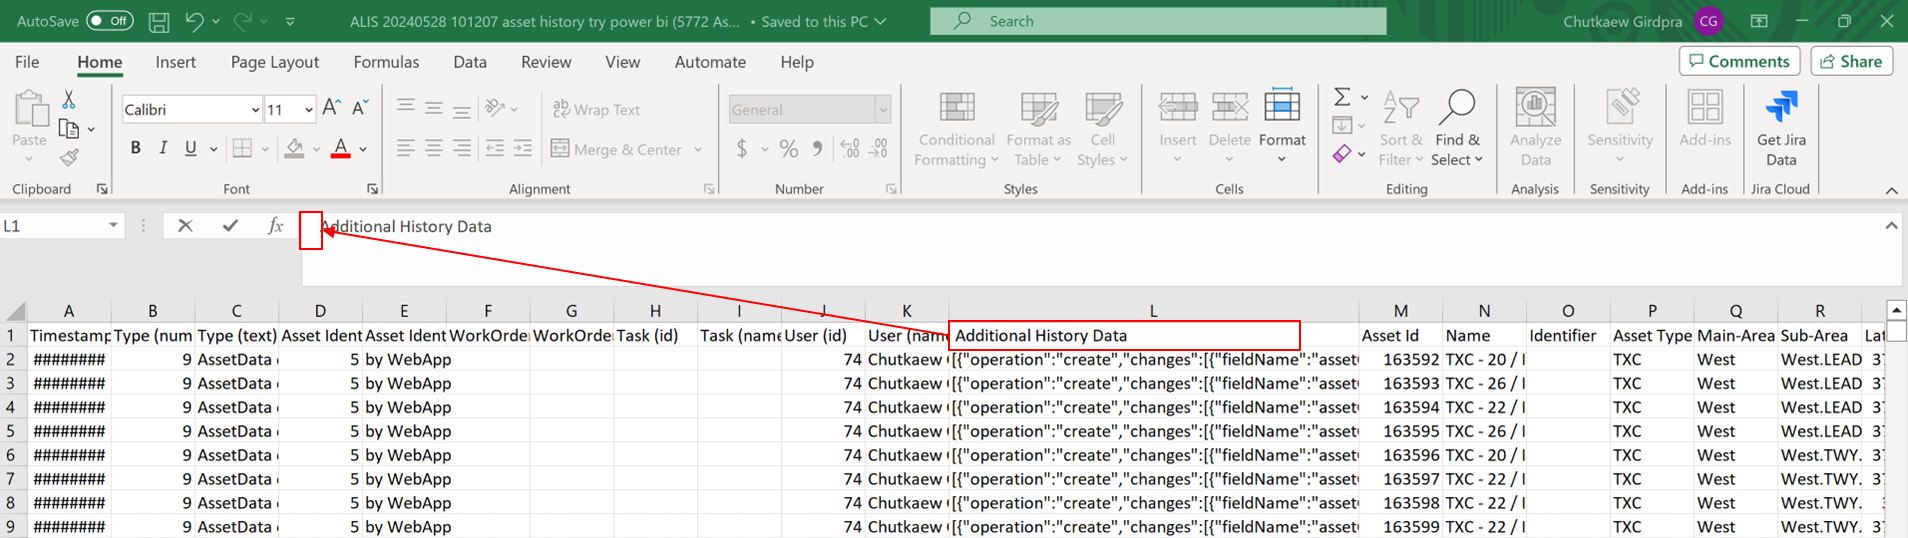
Go to your excel sheet

Click on the header of Additional History Data.
Then add a space in front of the word ‘Additional History Data.
Then remove the space that you just added (yes, we know you’re asking ‘why?'. See the explanation at the bottom 😉)
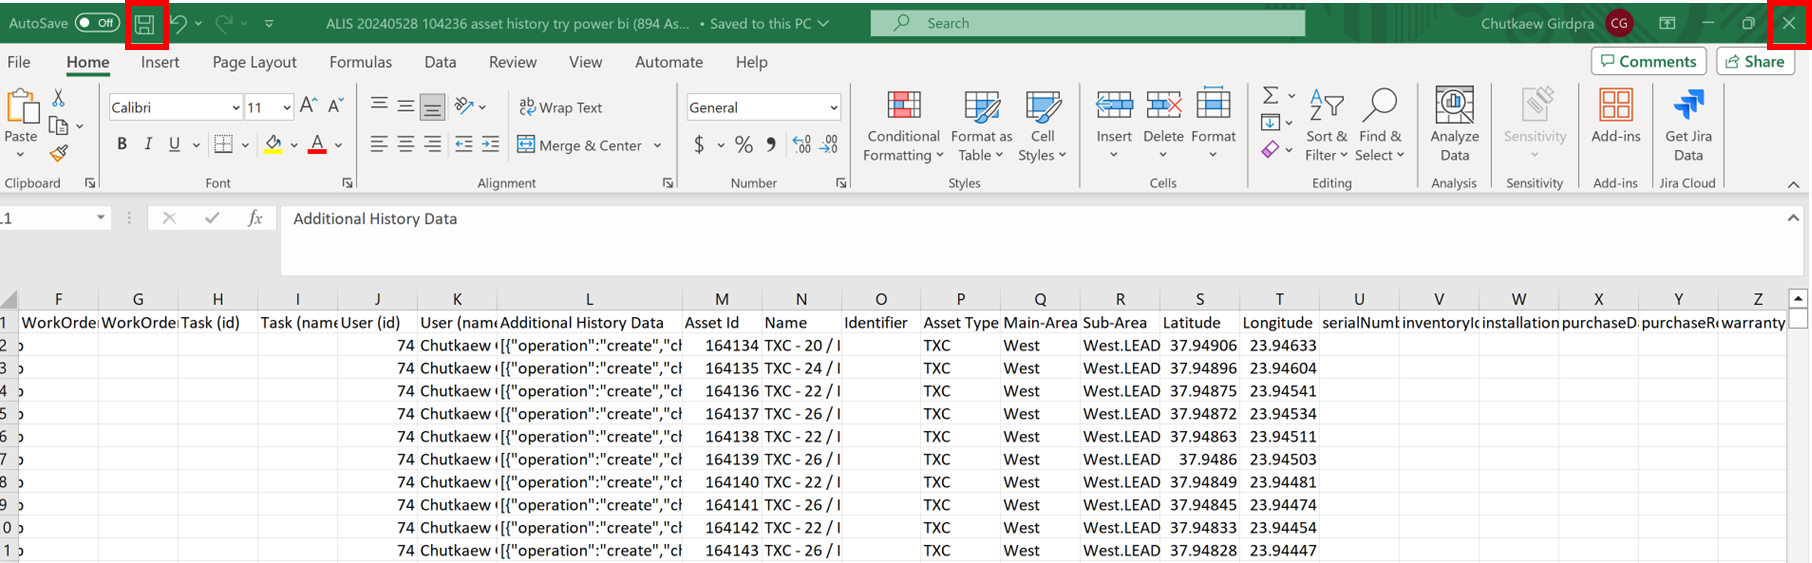
Save and close the excel file (
 Important that you close the excel file before continuing with Power BI)
Go back to Power Bi and click Refresh
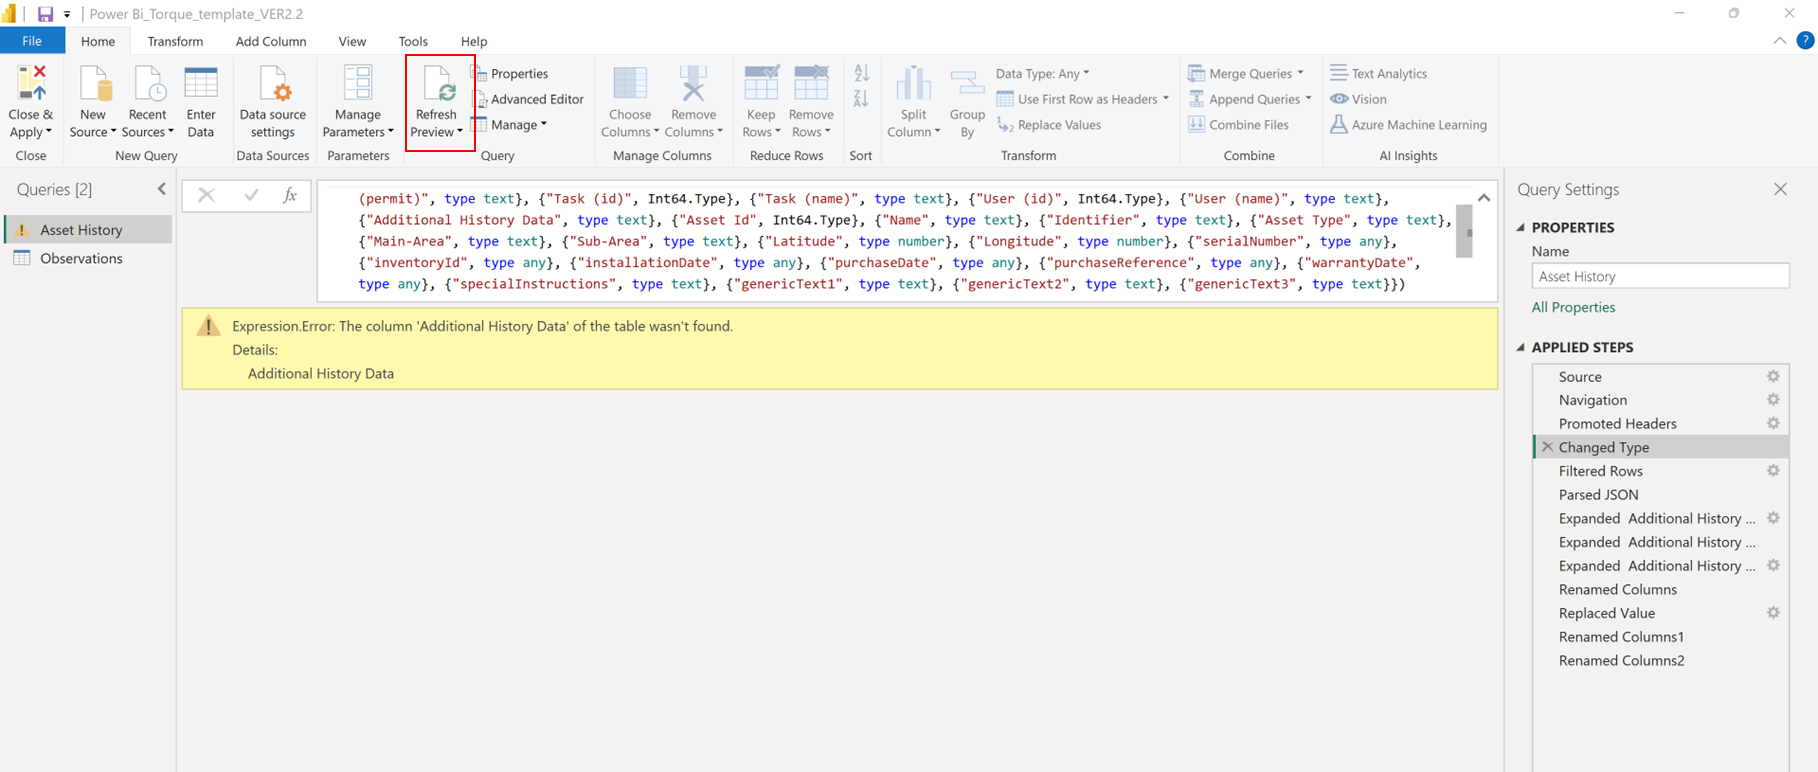
![]() Why does this error occurs?
Why does this error occurs?
there are a few potential explanations:
Metadata refresh: The action of adding and removing the space in the Excel header might lead Excel to update the metadata of the column. Power BI, upon refreshing the query to read the updated file, might detect this metadata change and accurately recognize the column that was previously not found.
Cached metadata: Power BI's query editor, Power Query, caches metadata during the initial data load. This caching mechanism might occasionally result in discrepancies between the actual data source and the cached metadata. When you modify the column header, Power BI refreshes its metadata cache based on the updated Excel file, allowing it to find the previously missing column.
Automatic metadata recognition: Power BI leverages an automatic metadata recognition feature that dynamically detects changes in data sources. This feature might have been triggered by the slight modification to the column header, causing Power BI to reconfirm and recognize the column that was previously not found.